Income Inequality Marches On

Welcome to 2018!  We are making some fundamental shifts to our Weekly Insights which I hope you will enjoy.  We are moving our content towards more video and free self-service analysis around our weekly topical theme. We welcome your feedback and your ideas. 


Over 70% of population health is now attributed to exogenous social factors. We will focus our attention from week to week on uncovering the nuggets of community health and development insights from the huge amounts of data in the public domain.


In this Weekly Insight, we looked at the issue of Income Inequality and specifically compared the 2013 American Community Survey results to the most recent 2016 data. 

  • Those households at risk which we define as earning less than $25,000 represent about 1 in 5.5 households. This is down nominally from 2013 to 2016.

  • Households in the middle class (earning from $25,000 to less than $100,000) are 53.9% of households and also a slight decline from 2013. 

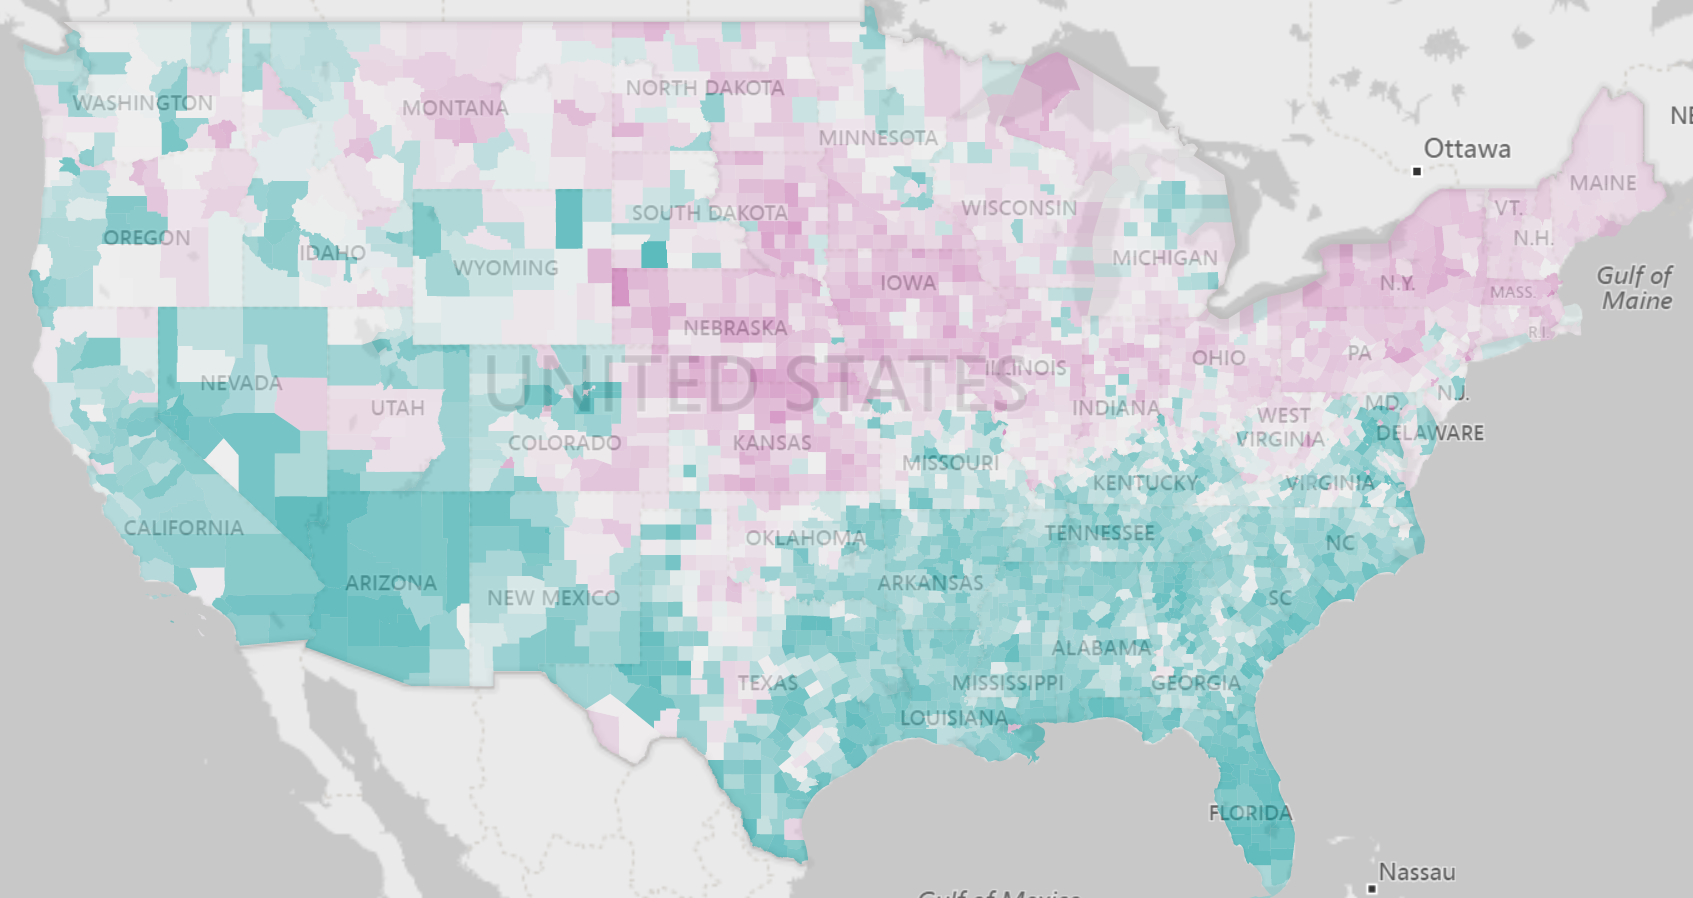
  • Households earning over $100,000 increased 2% from 2013 to 2016 and now represent approximately 1 in 4 households. However geographically, these are concentrated in the coastal cities.

  • We found some interesting geographic variations which are described in the video blog (2 1/2 minutes). 

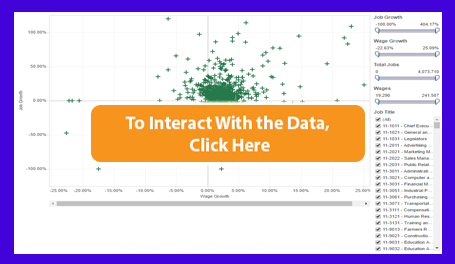
 I created a free Interactive where you can select the household income level and the map will display the relative geographic concentrations based on the national average. The table also shows the counties with the highest concentrations of that particular income level. The Free Interactive is a stripped down version of the Income Levels topic in the new Population Analysis Interactive


Share This Story

Similar Posts

  • Regional Disparities in Health Insurance

    We all know that health insurance is a moving target. According to the most recent ACS survey data, the national uninsurance rate declined from 13.0% to 11.7% in 2016. Public insurance coverages increased slightly more than private coverages (increases of .9% and .6%) respectively. This change was short-lived as Gallup…

  • Private Room Average Hospital Stays up 10%

    While average length of stay has experienced a long-term decline, one component of average stay seems to be increasing – private rooms. The average stay in a private room increased nearly 10% based on an analysis of the 2016 Medicare Provider Analysis and Review (MedPAR) data set.    Even more…

  • The Race for Nurses

    There is a race that is brewing between millenials who are becoming registered nurses and the hiring that has started at U.S. hospitals. A Health Affairs study concluded that Millennials are becoming registered nurses at nearly twice the rate of baby boomers, but that still won’t necessarily prevent a nursing shortage…

  • Students Moving Back on Campus

    The number of students living on-campus for the approximately 4,500 non-state institutions has increased from just over 43% in 2011 to nearly 53% just four years later in 2015. The pie graph below shows the movement from 2011 to 2015 with the yellow slice indicating the percentage of students living…

  • Room and Board Cost Increases Slowing

    After three straight years of 3-5% increases, room and board annual growth has finally slowed to a more pedestrian 2-3%. In recent years, universities have invested heavily in on-campus facilities and presumably passed these costs to the students at a rate greater than inflation. One administrator once told me that on-campus facilities…