Villanova vs. Michigan in Athletic Costs

Villanova clearly dominated Michigan on the basketball court and has now won the NCAA Men’s basketball tournament two of the last three years. But how has that success translated to other sports and to the athletic costs in general. 


The Equity in Athletics data is released annually by the Office of Postsecondary Education. This data is required by the Equity in Athletics Disclosure Act (EADA) for all co-educational postsecondary institutions that receive Title IV funding and that have an intercollegiate athletics program. The data tracks revenues, expenses, and participation by sport, gender, and team. Today we released the Athletics Interactive which provides ten years of Athletic data by these categories. We compute year-over-year changes and category to total ratios. This updated Interactive is now available to our subscribers. 


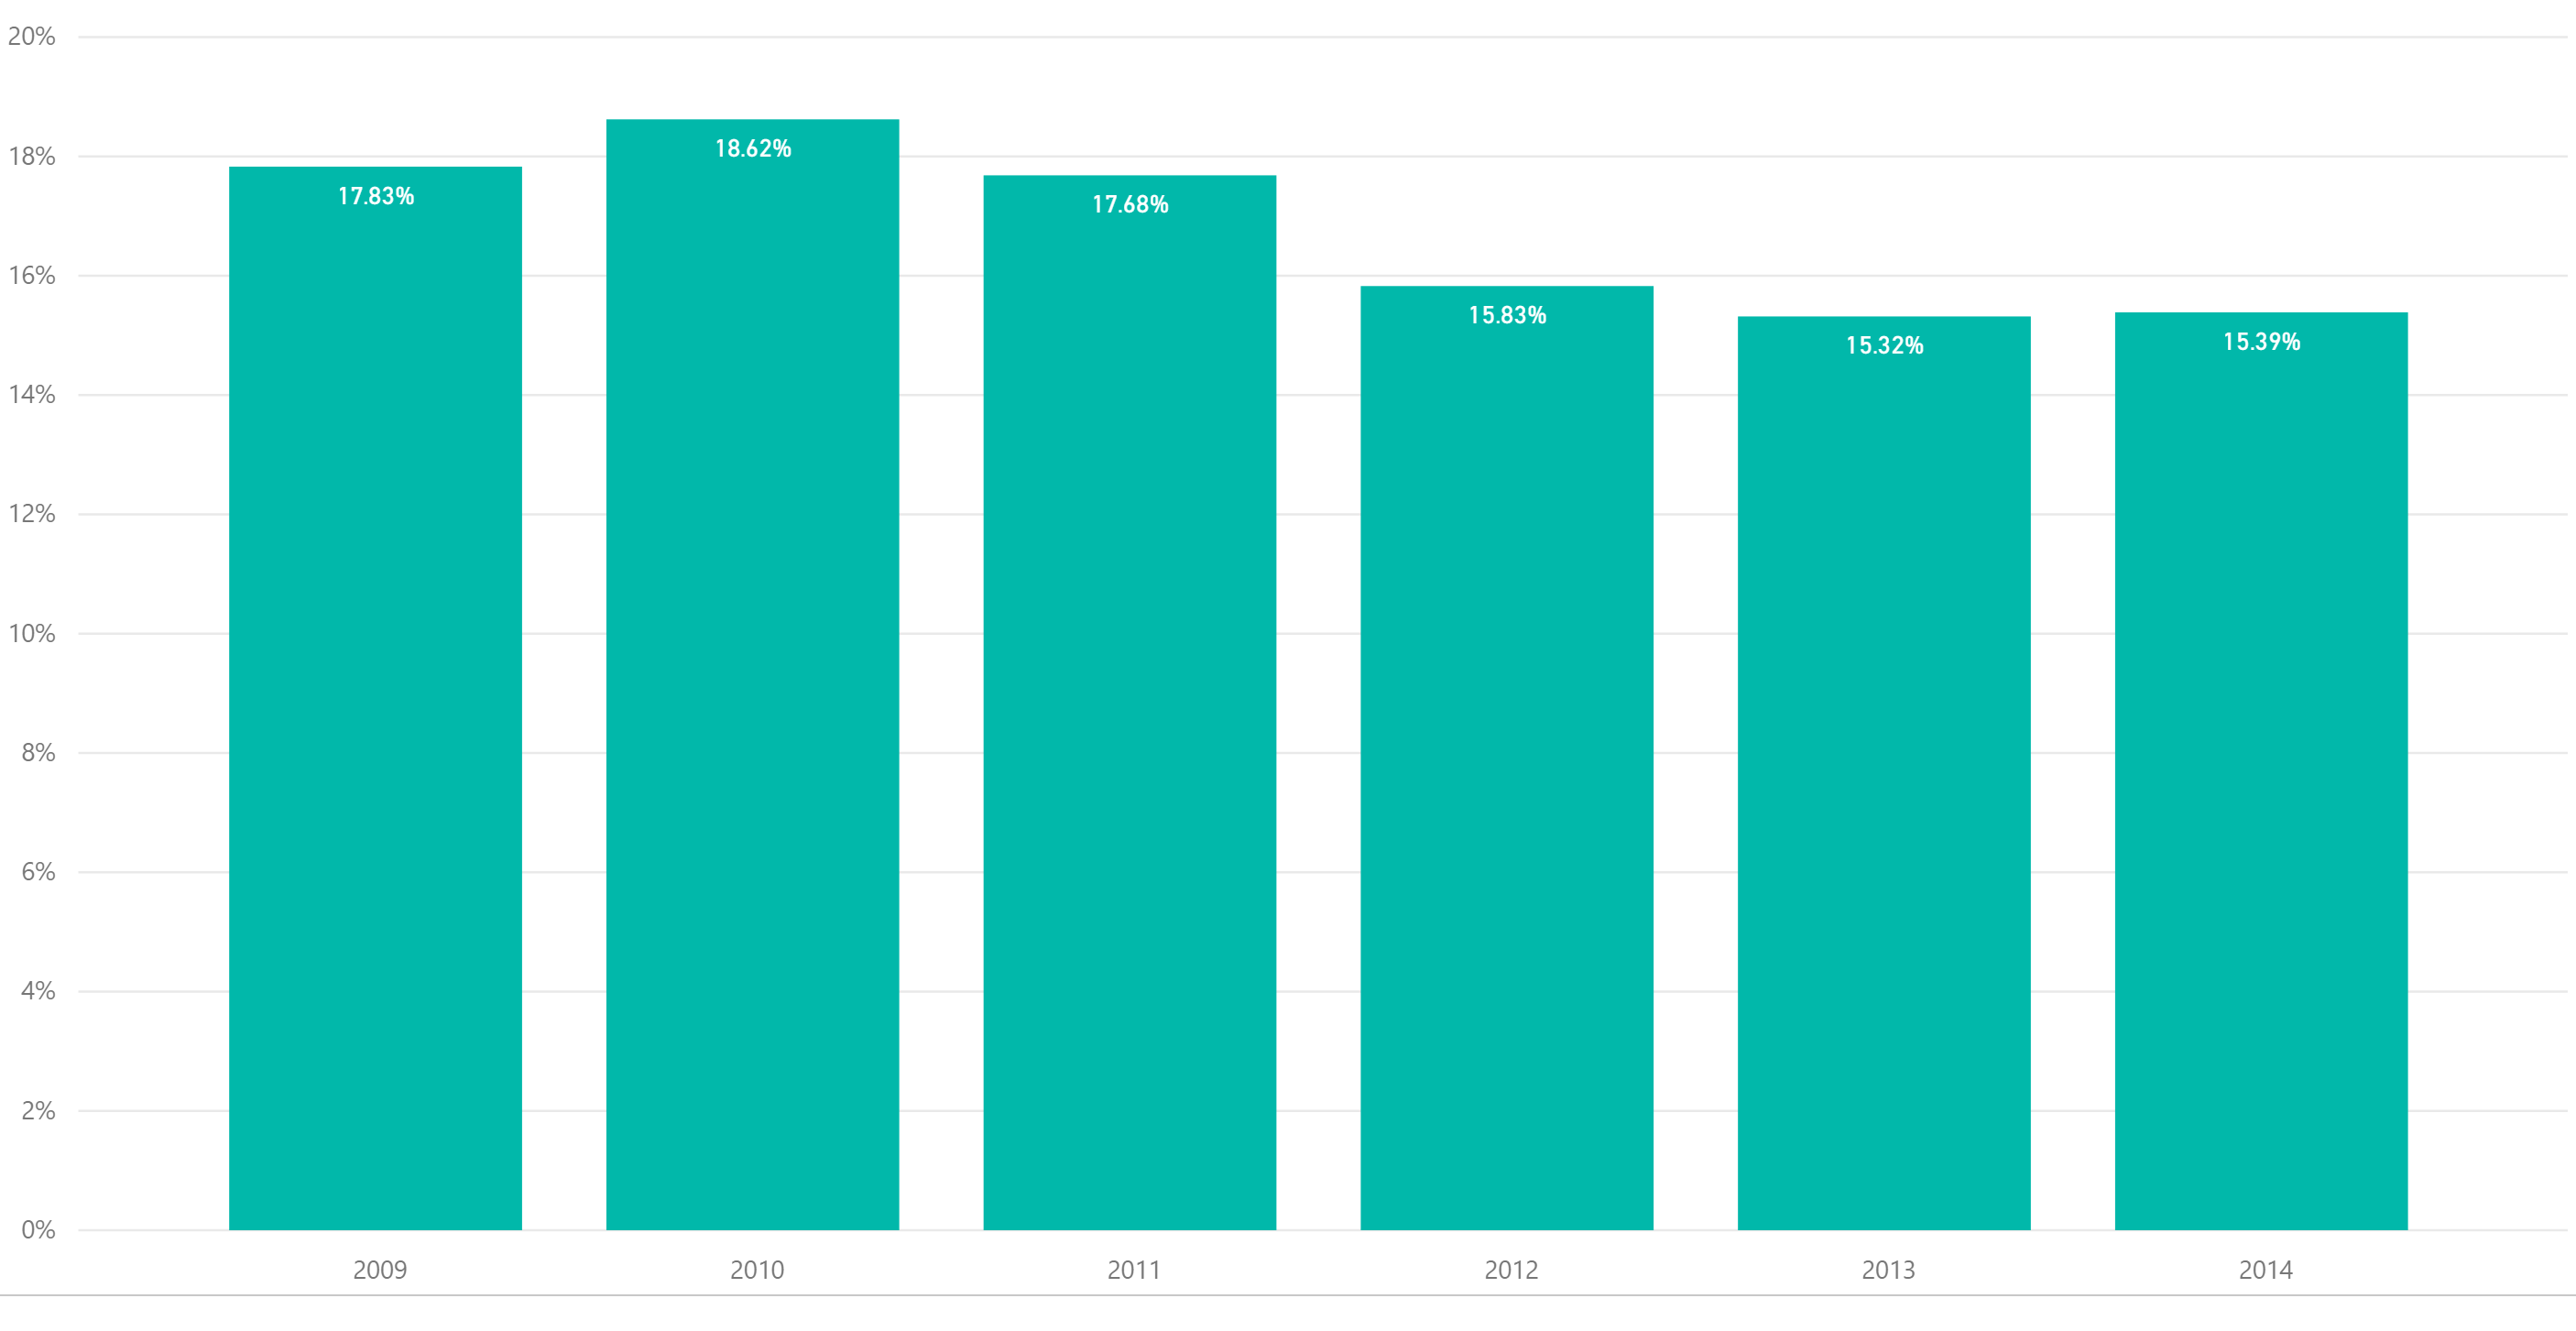
Villanova clearly is capitalizing on the strength of its basketball teams (men and women) as over 41% of its entire sports expenses comes from basketball. The big increase years for Villanova came in 2014 and 2015 when the sport of basketball doubled in proportion to other sports. Villanova’s budget for football is half what it is for basketball. Michigan, on the other hand, spends four times as much on football as basketball. While the Equity in Athletics data does not require disclosure of average salaries by individual sport, the average head coaching salary for Villanova increased a whopping 58% in 2017 to $618,216.  This is over four times the average instructional salary of $136,194. 


Finally, it is apparent the excitement of a winning basketball team has trickled to overall sports participation as Villanova sports participation across men’s and women’s sports teams has reached a ten-year high at 761 participants. 

Share This Story

Similar Posts

  • Infection Procedures Top Inpatient Volume Growth

    While Medicare inpatient procedure volume has remained flat since 2013, infections are a significant area of high volume change. The treemap below from the Inpatient Procedure Analysis Interactive shows the inpatient volume growth by procedure with color coding by volume change from 2013-2015 using the Medicare Provider and Analysis Review…

  • Tuition Bears Increasing Brunt of Higher Ed. Revenue

    In 2011, Tuition and Fees represented 20.6% of public institutional revenue. In 2015, it has increased to 24.25%. Most of the reshuffling of revenue has come from federal operating grants and contracts as noted by the graphs below. Interestingly, state appropriations have remained relatively constant. Similarly, non-profit institutions have seen tuition…

  • Student Default Rates for 2014 Flatten at 15.4%

    Last week we looked at student repayment rates and noted that longer-term repayment rates continue to decline for five and seven year repayment periods. Repayment rates are in essence a measure of optimism as it is the percentage of students who have made progress in paying down their student loans….

  • Inpatient vs. Outpatient – What the Numbers Show

    Analysts in health care don’t agree in unanimity very often, but most seem to agree that there will continue to be a quantum shift in healthcare from inpatient to outpatient. In this two part series, we will attempt to quantify and support this important trend. We utilized the Beds and…

  • Students Increasingly Opting for High Cost Debt

    Many prognosticators are projecting a coming economic crisis caused by student debt. This is typically focused around an inability to pay off the principal of the loan. But it really appears that we are also setting ourselves up for a real problem with the cost of debt.    Overall new…

  • Students Moving Back on Campus

    The number of students living on-campus for the approximately 4,500 non-state institutions has increased from just over 43% in 2011 to nearly 53% just four years later in 2015. The pie graph below shows the movement from 2011 to 2015 with the yellow slice indicating the percentage of students living…