In today’s competitive talent landscape, a robust recruitment strategy is crucial. A recent TATech webcast delivered by Public Insight and our client, Talivity highlighted how leveraging market data can significantly empower your recruitment efforts for 2026. The presentation, which is recapped below focused on using competitive benchmarking, KPI analysis, and sentiment tracking to make smarter, more informed decisions.
The webinar was led by industry experts: Peter Weddle (CEO, TA Tech), Jodie Cherry Roth (Sr. Director – Consulting, Talivity), and John Julio (Chief Operating Officer, Public Insight).
Building a Strong Foundation
A a strong recruitment marketing strategy begins with solid market data. The core elements of this strategy include:

Using Data for a Smarter 2026 Recruitment Strategy
The primary goal of this webcast is to demonstrate how you can inform your 2026 recruitment plan by leveraging competitor strategies, compensation data, and employee sentiment. Here’s how:

- Competitive Intelligence and Benchmarking:
- Monitor competitors’ job posting strategies.
- Benchmark key TA metrics and KPIs.
- Identify emerging skills and understand demand intensity.
- Benchmarking to Set Competitive Salaries:
- Gauge compensation competitiveness quickly.
- Identify opportunities to stand out with better benefits.
- Sentiment and Review Data:
- Monitor reviews in one central place.
- Strengthen employer brand by improving visibility in AI search results.
- Compare your scores against competitors.
- Utilize scores in recruitment marketing strategies.
The Labor Market Mood: Macro Headwinds for 2026
Understanding the labor market mood is crucial for shaping your recruitment approach. Key indicators to watch include:

The labor market mood is an early indicator of what’s ahead. Shifts in worker, job seeker, and employer confidence directly shape how people search, apply, hire, and commit.
As of September 2025, the signals are mixed. For example, worker confidence (or how secure someone feels in their job) is at a pandemic low, and this affects their overall sentiment. CEO confidence has inched up slightly in Q3, but increasing amounts of CEOs say they are looking to reduce headcount in the next 12 months. At the same time, worker commitment is at an all-time high, driven by uncertainty. Workers that have jobs are hunkering down and staying put and we continue to see that in quit rate data.
These are all important data points to consider as you are thinking about your 2026 planning.
Job Posting Insights
Job postings data and analysis provide a wealth of information to help inform recruitment strategies. The ability to segment data by titles, industries, locations/markets, and employers is critical.

US Job Posting KPI’s from January through August 2025:
KPIs Across the Top 10 Jobs Driving Demand:

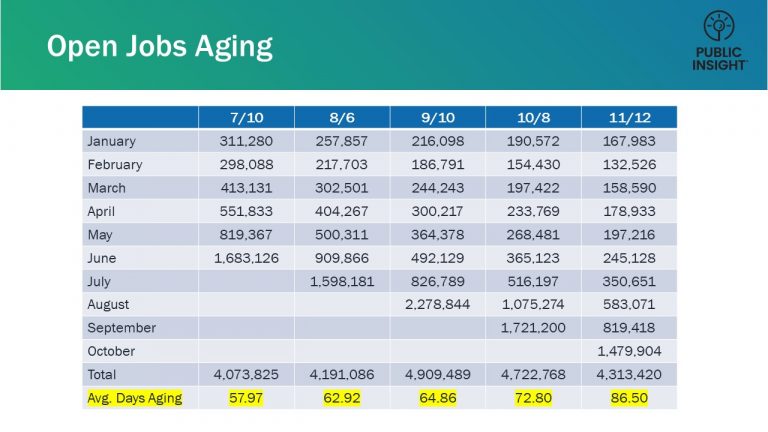
Ad indicators, such as Sponsored and Reposting Rate, and Fill Days can also be used to start building your strategy and budget.
For example, knowing how many days on average to fill a specific job title is useful to frame the story your are trying to tell. Whether it’s your story to hiring managers setting expectations on how long to expect to fill a role. Or as you formulate your budget using the time to fill as a guideline to know how long a posting or campaign needs to run.
Other indicators to track are encouragements (Military and Fair Chance), trending advertised skills, Active Job Seekers and education requirements
Example: Top Employers of RNs

The data from January to August covers total and net postings, reposting and sponsorship rates, quick apply usage, and even how many RNs at each employer have updated their resumes, and are likely actively seeking work. Know what your competitors are up to – the data tells this story:
Competitor Intel – 2026 Recruitment Action Plan
So what do you actually do with this data? When you walk into a budget meeting, instead of opinions, you’ve got evidence — posting trends, demand intensity, comp benchmarks.
This is how you prioritize investments and defend your budget requests. Analyze market data to uncover emerging skills or other trends before your competition even realizes they are happening. This lets you build pipelines early instead of scrambling to catch up.
Always localize your strategy. The labor market looks very different in Atlanta than in Denver. Data lets you dial budgets up or down based on real-time supply and demand in the zip codes, cities or states you care about.
Differentiate your offer by optimizing job ads before the new year when more jobs typically open up. Tweaking content, benefits, and messaging can help you cut through a crowded market and attract better applicants.

Compensation and Benefits
When it comes to Gen Z you need to use an old movie quote from Gen X “Show me the money”. It’s pretty telling when we learn that 58% of Gen Z candidates refuse to apply to jobs that don’t list salaries. A study conducted by AdZuna indicated that job postings that include pay receive six times more applicants. Jobseekers want transparency. So give it to them.
Eighty percent of candidates prefer additional benefits over pay. 1 in 10 would take a pay cut for better benefits. Only 50% of companies promote 1 or more benefits in there postings. Promote benefits in your posting. In fact, promote the benefits that make your organization unique beyond the standard medical/dental/vision.

Advertised Comp Trends:
From January though August we have seen 73.7% of all postings listing compensation. In the scatterplot graph below you can see which markets (states) are promoting comp at a higher level.
This data can be filtered down to the zip code so you can get very granular in your strategy planning.

Example: AI Engineers Comp
In the example of AI Engineer job titles in the graph below, we see a large comp range spread — salaries swing as much as $141,000 between min and max for some employers.
Demand for this skillset spans every industry — large tech companies, banks, consultancies, healthcare, and even manufacturers are competing for the same talent. Comp transparency is table stakes for this job title. Every employer in this data set is advertising comp.
For 2026 planning, a comp strategy could take this approach:
It’s not enough to know the numbers, you have to use them to decide when to lead on comp and when to differentiate elsewhere.

Compensation – 2026 Recruitment Action Plan
So what do you actually do with comp data like this? First, you use it to head into 2026 with credibility. Instead of saying “we think our pay is competitive,” you can show benchmarks across industries — that’s how you secure budget for critical roles.
Second, you use it to anticipate market spikes. If AI Engineers are commanding higher salaries in New York or the Silicon Valley, you can localize offers before competitors catch on.
Third, you can shift the conversation from just salary to total rewards. Where you can’t lead on pay, you can win by promoting benefits, flexibility, and career growth that others aren’t talking about.
And finally, you can get ahead on retention. If your ranges lag the market, the data tells you where to invest in programs that keep your talent so you’re not losing people the moment a higher offer comes in.

Employer Sentiment and Review Data
After you’ve done everything right to attract a qualified candidate, they click on the job, but before they apply, they Google the employer, or ask ChatGPT what it is like to work there.
Then they read a few Glassdoor reviews and walk away.
And this isn’t rare—it’s routine. Eighty six percent of job seekers check reviews. One bad comment, one outdated rating, and you’re out of the running—before you even had a shot.
We’re seeing great employers lose top candidates, watch their cost-per-hire climb, and waste media dollars attracting talent that never converts.
Actively monitoring reviews and your employer reputation is more critical than ever, because AI tools like ChatGPT present company sentiment directly to candidates. This shapes their perception before they visit your career site or talk to a recruiter.

Public Insight has analyzed over 1.4M review ratings from candidates since January 1st. We’ve seen some key indicators (Culture, Job Security, Work-Life Balance and DEI) trending downwards.
In the chart below we show data from the top five titles with the highest review counts.

Example: Sentiment of Crew Members and Cooks
Let’s look at sentiment, because reviews and reputation are shaping candidate decisions in real time.
In the example below, we look at crew member and cook sentiment across Glassdoor and Indeed. Trader Joe’s and Raising Cane’s are standouts with culture, DEI, and referral intent above 80%. At the other end, Dunkin’, Wendy’s, Taco Bell, Little Caesars, and Sonic cluster at the bottom with weak scores across comp, culture, and management, and referral rates below 50%.
So how can we use this type of data for our 2026 recruitment strategy?
This is where sentiment data moves from being a reputation scorecard to a real lever you can pull in your 2026 strategy

Employer Reviews – 2026 Recruitment Action Plan
So what do you actually do with sentiment data like this? First, think about retention. If review scores are sliding on culture or management, that’s your early warning before turnover spikes. It gives you the chance to fix issues internally instead of reacting after people leave.
Second, you can use it to stand out in the market. Highlight the areas where your ratings are strong, whether whether that’s culture, DEI, or work-life balance. Make sure that comes through in your job ads, career site, social media and during interviews. That’s how you differentiate when competitors are struggling.
Third, sentiment helps you prioritize where to generate positive reviews. If low scores are hurting visibility in AI tools where candidates are going first, this is where you need to focus review generation campaigns in 2026.
And finally, you can use competitor weaknesses to your advantage. If their ratings are declining, that’s your sourcing opportunity. Target those employees directly with campaigns that showcase what you do better.

Daily Data Habit
This isn’t just interesting talent market data to glance at once a year — it’s a toolkit you can use every single day.
First, use it to prioritize investments. You know which roles are toughest to fill, where demand is heating up, and where the competition is overspending. That’s how you focus your time and defend budget requests with confidence.
Second, use it to differentiate your offer. Benchmarking comp and benefits tells you where you can stand out. Sentiment data tells you what candidates value and where competitors are failing. That’s how you carve out a stronger position in the market.
And third, use it to optimize execution. From job ads to sourcing tactics to employer brand messaging, the benchmarks give you a constant feedback loop to adjust and improve.
Talent market data isn’t just a rear-view mirror. When you make it part of your daily habit it becomes the steering wheel for your 2026 strategy. It helps you see what’s coming to make smarter moves, and win talent in a competitive market.

Summary
Our recommended actionable steps include the following:
- Leveraging Competitor Intelligence: Monitor posting strategies, time-to-fill metrics, compensation, and quick apply rates to gain a competitive edge.
- Action: Track job postings by sector, monitor compensation trends, and analyze quick apply rates.
- Benchmarking Salary and Benefits: Understand salary expectations, promote benefits effectively, and consider offering better benefits over straight pay increases.
- Action: Include salary ranges in job listings, highlight benefits in job ads, and be prepared to discuss total rewards.
- Tracking Sentiment and Review Data: Monitor online reviews and address negative feedback to improve your employer brand.
- Action: Actively manage your online reputation, address negative reviews, and leverage positive reviews in your recruitment marketing and interviewing.
In conclusion, leveraging market data is not just a trend but a necessity for empowering your 2026 recruitment strategies. By focusing on competitive benchmarking, KPI analysis, and sentiment tracking, you can make informed decisions that attract top talent and drive success for your organization.
Watch the Recorded Webcast
Try Out Insights for Free (No Sign Up Required)
Try Our Free Version of TalentView to Get Instant Compensation, Postings, and Fill Days Insights By Title, Company and Location

How Would Your Company, Competitors, Industry and Job Titles Compare?
Wouldn’t you want these insights for your industry, job titles, locations and to compare against competitors?
What is TalentView?
Public Insight develops TalentView, a talent market intelligence solution that generated these insights. The most current and detailed insights are available by title, employer, location, industry and more. We provide flexible ways to utilize talent market intelligence, which include data licensing, interactive dashboards and reports.
How Can Our Must-Have Insights Help You?
- Inform/Justify Recruiting Decisions and Prepare For Hiring Manager Discussions
- Inform Recruitment Marketing Budgets, Strategies and Priorities
- Benchmark Employers Against Competitors
- Enhance Your Solution Offering (Solution Providers)
- Identify Business Development Opportunities (Solution Providers)
- Develop Content for Account Management and Marketing (Solution Providers)
Get Started!
Schedule a Call – Let’s discuss and demonstrate how you can leverage talent market data and insights
Sign Up for a Trial – Try out our interactive dashboards or get sample data