Public Insight’s December 2024 Jobs Report summarizes market insights from the millions of job postings, resumé updates and employer ratings/reviews available in our TalentView platform in addition to broader labor and macroeconomic indicators.
December 2024 Jobs Report Summary
- Job posting volume declined 9.9% in December to 2.6 million, which is reflective of typical seasonal patterns.
- Market urgency is practically zero, a far cry from the days of 2021-2022 when every other job was urgent.
- Compensation increases have stayed flat for December, but still have double digit increases over the course of 2024.
- A flood of new resumes entered into the market in December. Over 51 million new unique resumes have been published in 2024 or roughly 25% of the active workforce.
- Comparing resumes to the number of unique (net) positions of 36 million over the past nine months suggests an overabundance of workers desiring to enter new positions.
- Supply and demand has rapidly shifted from parity or unmet demand to slight to moderate oversupply of seekers to positions over the last quarter. A notable exception remains Health Care where there still remains heavy unmet demand.
- Workplace sentiment as measured by Net Promoter Score after declining to lows earlier in 2024 has rebounded late in 2024 and is now comparable to the start of the year.
- Unemployment remains historically low as well as layoffs. Quit rates have declined significantly since 2022. Workers may be signaling they want to change with resume postings, but they are not quitting their existing jobs to do so.
Key Job Postings Takeaways
- Job posting volume declined 9.9% in December to 2.6 million, the lowest point in 2024. However this is likely due to seasonal declines.
- Volume declines ranged across industry sectors with exception of Accommodation Services, which increased 3.5% due to holiday travel.
- Fill Days based on the trailing twelve months of activity remained fairly constant at 46 days. (We now have eliminated stale or evergreen ads that are older than one year in this metric).
- Open Days has remained steady at 66 days, also eliminating evergreen jobs.
Posting Volume
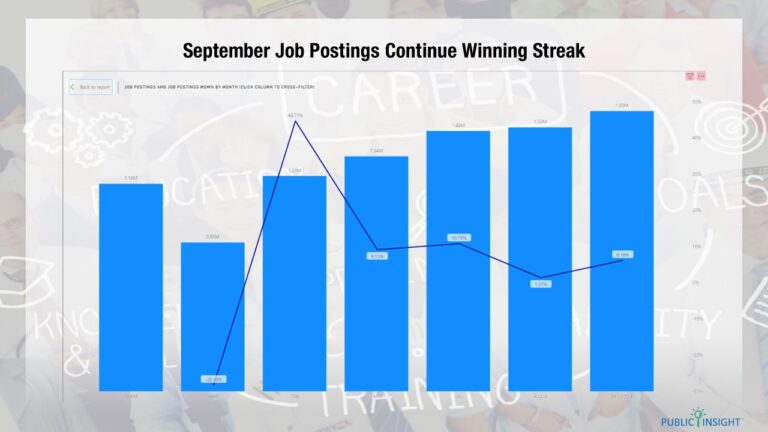
Job postings declined 9.9% in December to 2.6 million, the lowest point in 2024. However with the Christmas holiday in the middle of a work week, only 18% of job postings occurred after 12/22. Job postings historically decline in the last month of the year. In 2023, postings also declined 14%.

Volume declines ranged across industry sectors with exception of Accommodation Services, which increased 3.5% due to holiday travel. Education was the biggest decliner at 18.3%. December volume is two months removed from a very solid October at 3.6 million.
January postings thus far through the ninth of the month are just over one million indicating a solid start to the new year.
The market may be settling into wait-and-see mode with the arrival of a new administration. For example, urgency rates are practically zero.
Reliance on paid/sponsored postings has been steadily increasing (see graph below) since we started measuring the Indeed pricing tier metric in September. Pricing tiers define the type of pricing plan level companies have (or don’t have) in place with Indeed at the time of the posting.

Fill Days
Fill days use ad expiration and ad removal to determine a presumptive hire date. When measured over a prolonged time period and over millions of postings this metric provides a strong glimpse of the overall market.
The trailing twelve months is used as a time horizon for our analysis. We now eliminate stale or evergreen postings which are defined as those postings older than one year.
In the graph below, we show the fill days by month (red/green graph) along with the percentage of ads (blue line) that have been filled. Obviously, the newer ads have a lower fill rate.

Fill days as a composite for the twelve months is 46 days encompassing 19 million ads and 87% of all ads over that time period. Fill days range from 40 to 49 days for months where over 90% of ads have been filled.
Open Days
Open days are postings that are still determined to be open. We track every job posting uniquely and ascertain its fill status on a weekly basis. Generally, we have found that nine months to be a suitable time horizon to evaluate the age of open days. Older postings may distort the open days as they may represent “evergreen” postings. For this reason we eliminate implied evergreen ads that are older than one year.
The graph below shows the aging of open postings for the past nine months. This value has held fairly steady, ranging from 64 to 67 days. The current number of open postings reflected in the graph is 2.8 million. The composite aging of open postings is 66 days representing 17% of all postings during this period. The blue line shows the percentage of ads for that month that are still open.

Key Compensation Takeaways
- December compensation was flat in December, but up 11.2% for the trailing twelve months.
- Compensation range as a percentage of the midpoint compensation increased to a twelve-month high of 25.4%.
- Sectors with December growth include Transportation, Manufacturing, and Technology.
Compensation Composite
Mid posted compensation was flat in December at $67,100 on a composite basis across all job postings. However compensation has increased 11.2% over the trailing twelve months.
In addition as highlighted by the graph below, the range between the max and min posted values has increased as a percentage to a twelve-month high of 25.8%. This suggests that employers are giving themselves more negotiating room for advertised compensation.

Compensation by Industry Sector
- Sectors experiencing meaningful wage growth in December include Transportation (7.4%), Manufacturing (2.1%), and Technology (2.4%).
- Technology, and Information and Media is most noteworthy as earlier in the year this sector was experiencing compensation declines in line with layoffs and hiring slowdowns. This sector now has a five-month growth streak.
- Sectors with the largest declines in comp include Accommodation Services (1.9%) and Consumer Services (1.0%)

Key Supply and Demand Takeaways
- Healthcare supply imbalances continue with the gap getting worse.
- Accommodation Services and Retail have now flipped from supply heavy to demand heavy over the past quarter.
- Transportation, Logistics, Financial Services, and Wholesale are showing a trend towards unmet worker demand.
While the labor market remains robust there are still acute shortages of workers in certain sectors. We measure relative supply/demand using net openings against resumes by sector.
Resumes
The number of unique resumes that were published on the Indeed platform increased 43.2% in December and stopped a seven-month trend of declining resumes. The end of the year is a typical time for job seekers to get their resumes updated.
The number of resumes published during the past year is 51 million compared to the number of unique (net) positions of 36 million. This results in the tilt of our supply/demand by sector towards supply abundance.

Supply/Demand Chart By Industry Sector
To highlight supply/demand imbalances, we superimpose job seekers based on resumés against net job positions, which are hires based on unique postings shown in the black bar. We can then look at this supply and demand in diverse ways.
The graphs highlight supply surplus (more job seekers than net postings) shown in green or supply shortage (less job seekers than net postings) shown in red. We picked a time horizon of nine months which highlights the current market surplus or shortage. The total bar reflects the summaries of openings and resumés for that time period.

Supply/Demand Scorecard
We highlight the current state at the end of December as well as the most recent changes over the last quarter. A change is not necessarily good or bad, but we have highlighted changes in supply/demand gaps that significantly impact the current trends.
A common thread below is the abundance of job seekers signaling their entrance into the market. As always Hospitals and Health Care remain stressed to meet the position demand.
| Sector | Current State Supply/Demand | Previous State Supply/Demand |
| Hospitals and Health Care | Heavy Unmet Demand | Heavy Unmet Demand |
| Accommodation Services | Moderate Oversupply | Slight Oversupply |
| Retail | Moderate Oversupply | Slight Oversupply |
| Professional Services | Parity | Moderate Unmet Demand |
| Manufacturing | Moderate Oversupply | Parity |
| Transportation, Logistics, … | Parity | Moderate Unmet Demand |
| Construction | Parity | Moderate Unmet Demand |
| Technology, Information, … | Moderate Oversupply | Parity |
| Financial Services | Slight Oversupply | Slight Unmet Demand |
| Education | Slight Oversupply | Slight Unmet Demand |
| Consumer Services | Moderate Oversupply | Parity |
| Entertainment Providers | Moderate Oversupply | Parity |
| Wholesale | Slight Oversupply | Slight Unmet Demand |
| Administrative and Support Services | Moderate Unmet Demand | Moderate Unmet Demand |
Key Worker Sentiment Takeaways
- Net Promoter Score (NPS) has declined to twelve-month lows although the downward movement has leveled off over the past month.
- Communication and management continue to be the subjects that employees cite negatively while team, culture, and benefits are cited positively. These continue to trend downward to 15-month lows.
Net Promoter Score Rebounds
Net Promoter Score after bottoming out in the fall has rebounded to match the score at the beginning of the year. Net Promoter Score is measured based on the percentage of positive reviews over negative reviews. A score of 15.8 out of 100 means there are only marginally more “fans” than there are “detractors.”

Net Promoter Score by Industry Sector
The graph below breaks the Net Promoter Score further down by Industry Sector.

- Notable improvements include Professional Services (10.6%), Hospitals and Health Care (10.6%), Transportation (7.0%) and Administrative and Support Services (4.6%).
- Notable declines occurred in Retail (12.4%), Accommodation Services (8.5%), Education (6.3%), and Financial Services (3.0%).
Key Labor Market Takeaways (Data through November 2024)
- Job Openings were up 3.3% in November to 8.1 million. Job openings were down 6.9% overall through November 2024, but still up 12.5% since the start of 2021.
- Job Hires were down 2.3% in November to 5.3 million, but still below the June low point of 5.2 million. More concerning is that the hire rate at 3.3% is well below historical levels since 2021 of 3.9%%.
- Layoffs and Discharges were flat in November but were the highest point since January 2023. However the rate of layoffs remains comparable to historical trends.
- Quits were down 6.6% in November and at a multi-year low. The Quit Rate, after peaking at 3.0% in 2022, is now down to 1.9%.
- Unemployment rates continue to be low by historical standards at 4.0% and have declined from the July 2024 peak of 4.5%.
Get More Insights!
Try Our Free Version of TalentView to Get Instant Compensation and Postings Insights By Title, Company and State (No Sign Up Required)

What is TalentView?
Public Insight develops TalentView, a talent market intelligence solution that generated these insights. The most current and detailed insights are available by title, employer, location, industry and more. We provide flexible ways to utilize talent market intelligence, which include interactive dashboards, reports and data integration via API.
How Can Our Must-Have Insights Help You?
- Inform/Justify Recruiting Decisions and Prepare For Hiring Manager Discussions
- Inform Recruitment Marketing Budgets, Strategies and Priorities
- Benchmark Employers Against Competitors
- Identify Business Development Opportunities (Solution Providers)
- Develop Content for Account Management and Marketing (Solution Providers)
Get Started!
Schedule a Call – Let’s discuss and demonstrate how you can leverage job/talent market insights
Sign Up for a Trial – Try out our interactive dashboards or get sample data for proof of concept