Death Rate Continues to Inch Up

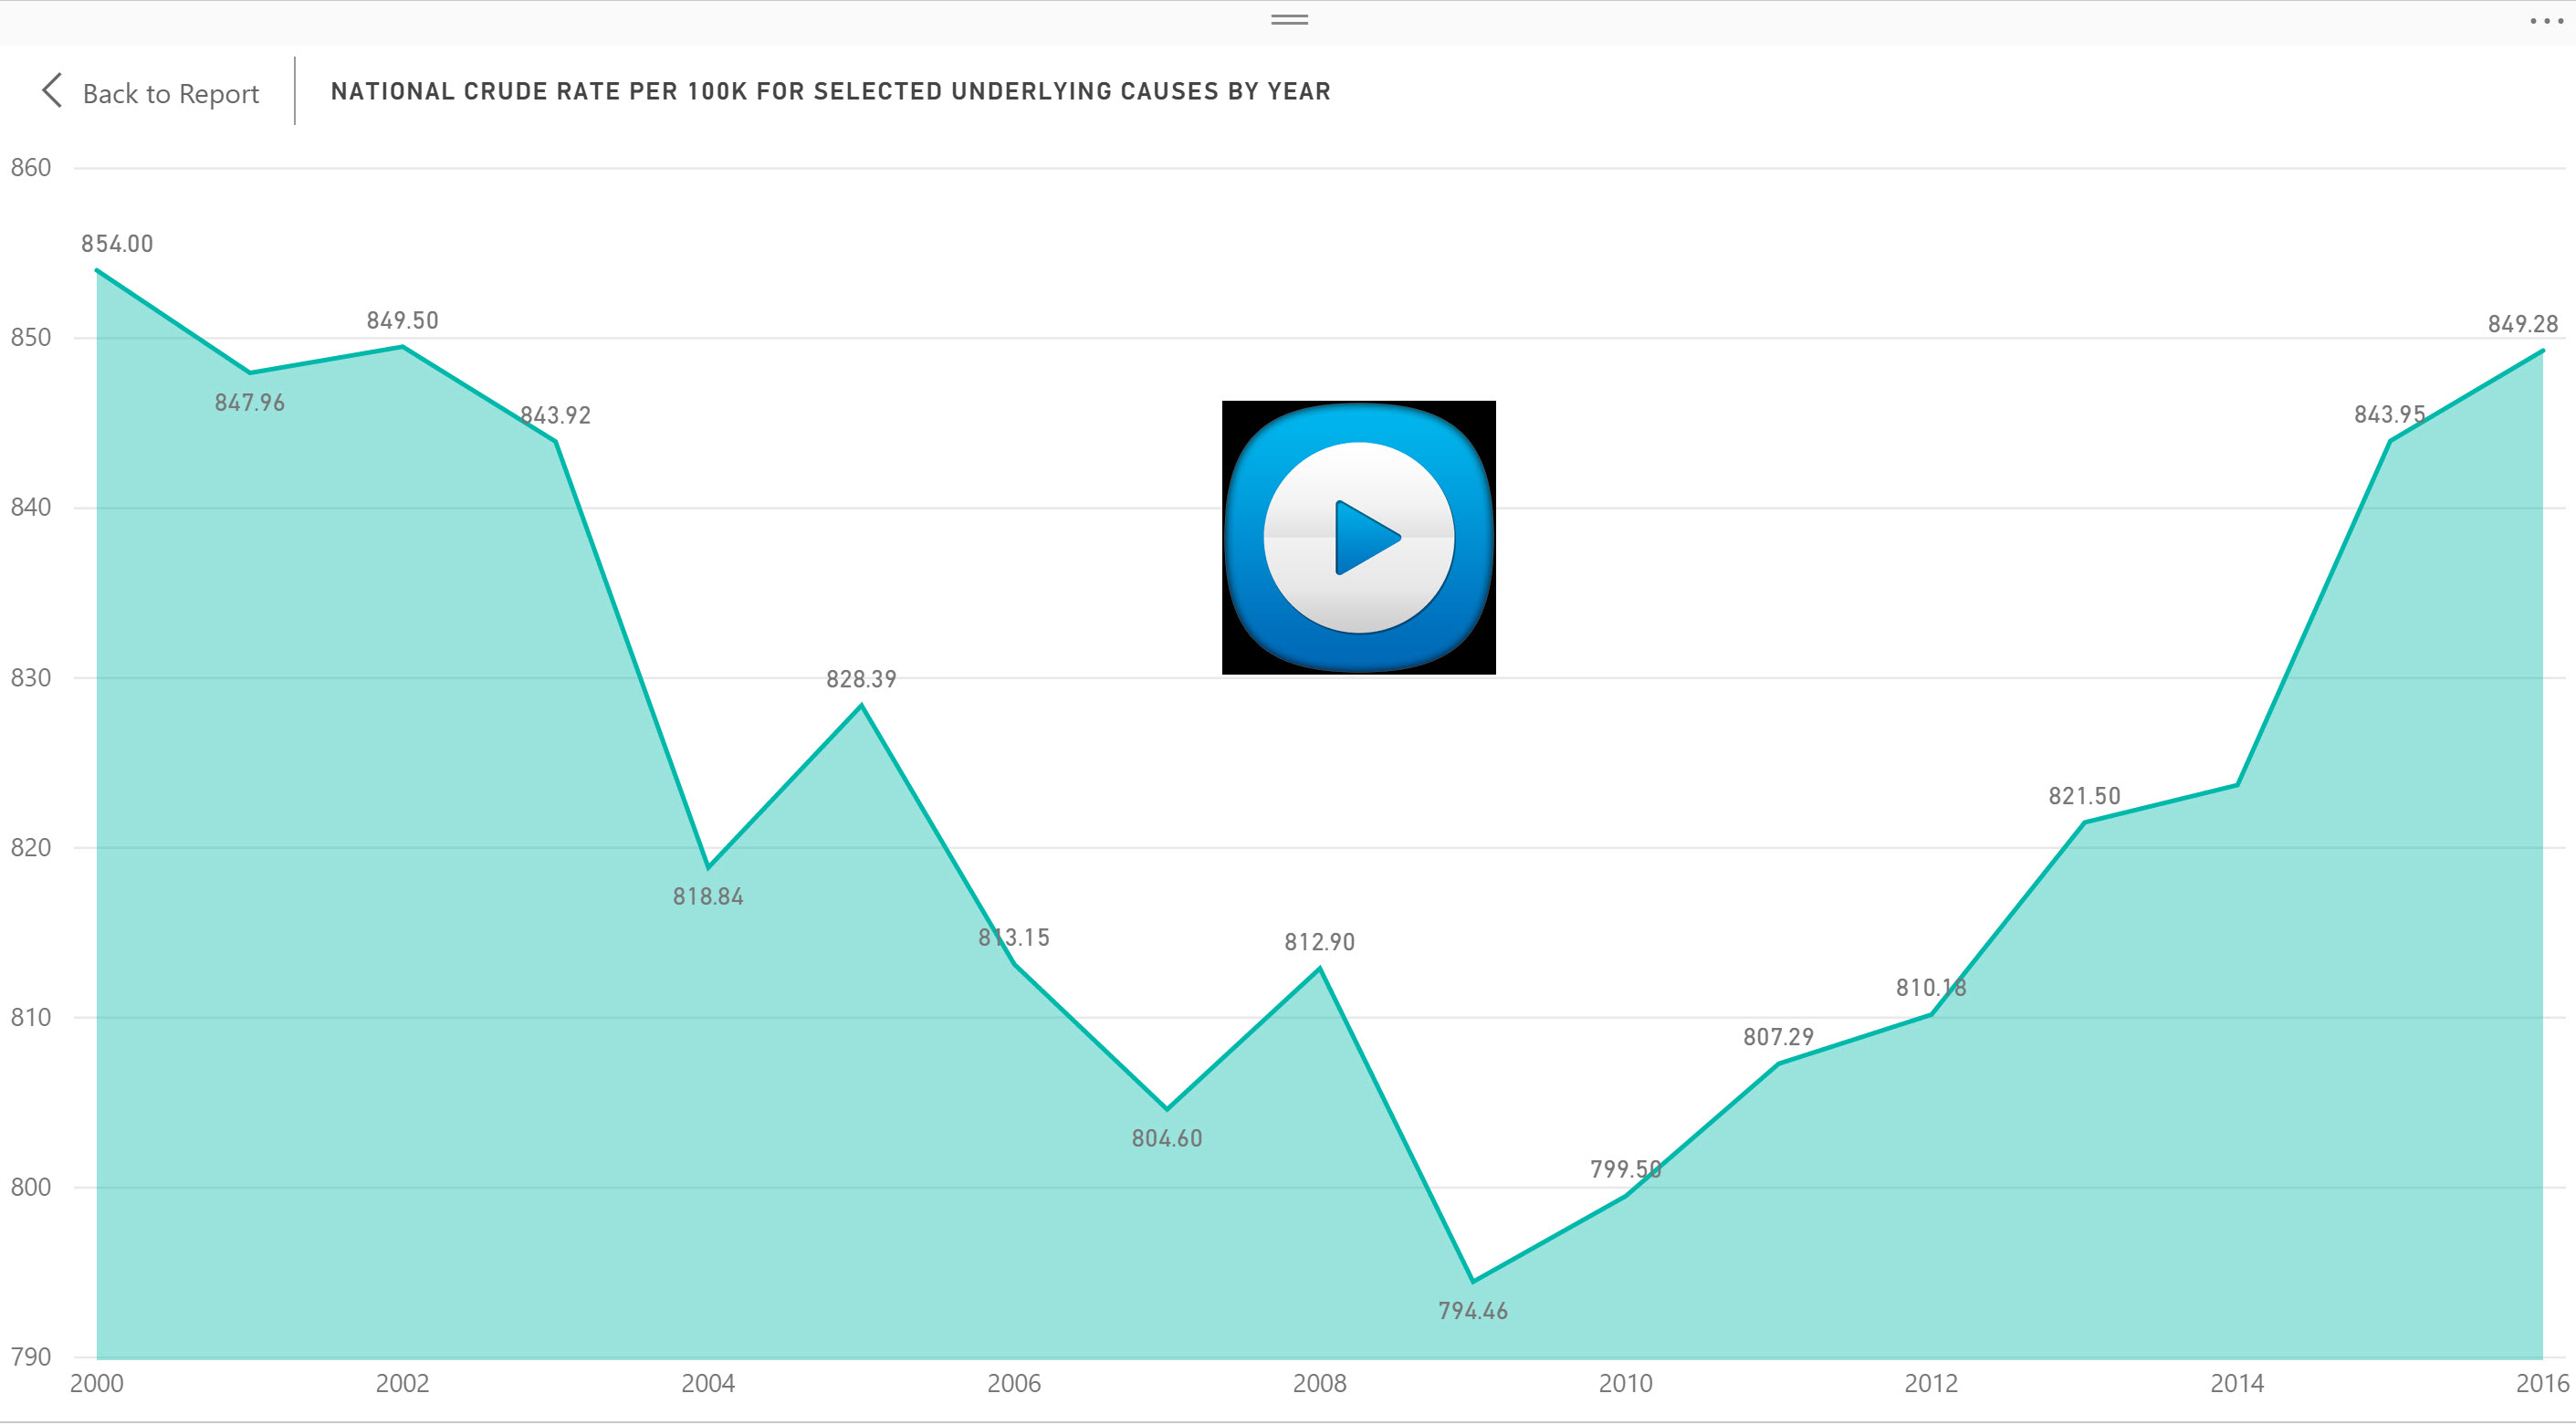
The mortality (or death) rate increased nominally from 2016 to 2017 going from 844 to 849 deaths per 100,000. This probably is not earthshaking news but based on the overall crude rate, it has actually been increasing since 2009 as noted by the following graph.


Advances in medical care have brought down most cause (ICD10) classifications. However, there are several groups of codes that are pushing the mortality rate up. These include mental and behavioral disorders (“F” Codes), diseases of the nervous system (“G” codes), and external causes (“V to “Y codes). External causes, which include drug overdoses, have gone up nearly 8% in the past year and 24% since 2009, when the overall death rate resumed its climb. We examine these causes in my video blog


Share This Story

Similar Posts

  • Powerball and Endowment Wealth per Student

    Large dollars tend to attract many of us. That is why the Powerball attracted so many people at the tidy sum of 1.3 billion. Yet the larger the number, the more people participate. Someone had the brilliant idea of distributing Powerball winnings to everyone in the country thinking it would…

  • CMS Introduces New Hospital Returns Measure

    The most recent batch of Hospital Compare data has expanded the whole area of readmissions, returns, and deaths. There are now separate measures for mortality rates, readmissions, and hospital returns. The hospital returns measure is brand new, with the most recent data through June 2016, and applies to heart attack…

  • New Data Highlights Student Loan Repayment Rates

    According to the Institute for College Access and Success, seven in 10 seniors (69%) who graduated from public and nonprofit colleges in 2014 had student loan debt, with an average of $28,950 per borrower. Over the last decade—from 2004 to 2014—the share of graduates with debt rose modestly (from 65%…

  • Using AI to Break Down Head Count

    New Microsoft® Power BI Visual Dynamically Analyzes Categorical Data Like fashion goes in and out of style, so do visual ways of exploring data. Several decades ago I worked with a visual called the Decomposition Tree from an upstart company Proclarity from Boise, Idaho to analyze multi-dimensional data. That company…

  • Degrees, Jobs, and Crosswalks

    My daughter has a Bachelor’s Degree in Fine Arts with a concentration in Cartooning and Illustration. Today, she is a quality assurance manager for a software company. I am very glad that her career has morphed into a burgeoning field because it was very clear to me that it would…

  • Where the Vets Live

    As we approach this Memorial Day Weekend, we pause to remember the sacrifice made on our behalf by our veterans. Nationwide veterans comprise 8% of the population. But there are clusters of populations where veterans comprise much higher percentages of the population. This article from Trulia published in Forbes back…