
In this Data Dan video, Dan uses data from the Equity in Athletics data set from Title 9 Participating schools to look at fringe sports at colleges across the country.
Last week we introduced the new CMS opioid data set and what it means. This data tries to initiate transparency around this hot topical area even though Part D Medicare claims may not be the best proxy of all opioid prescription activity. There are three elements to this data: Part…
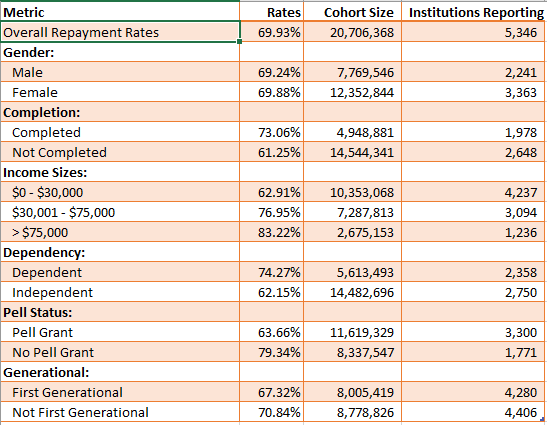
According to the Institute for College Access and Success, seven in 10 seniors (69%) who graduated from public and nonprofit colleges in 2014 had student loan debt, with an average of $28,950 per borrower. Over the last decade—from 2004 to 2014—the share of graduates with debt rose modestly (from 65%…
We all know that health insurance is a moving target. According to the most recent ACS survey data, the national uninsurance rate declined from 13.0% to 11.7% in 2016. Public insurance coverages increased slightly more than private coverages (increases of .9% and .6%) respectively. This change was short-lived as Gallup…
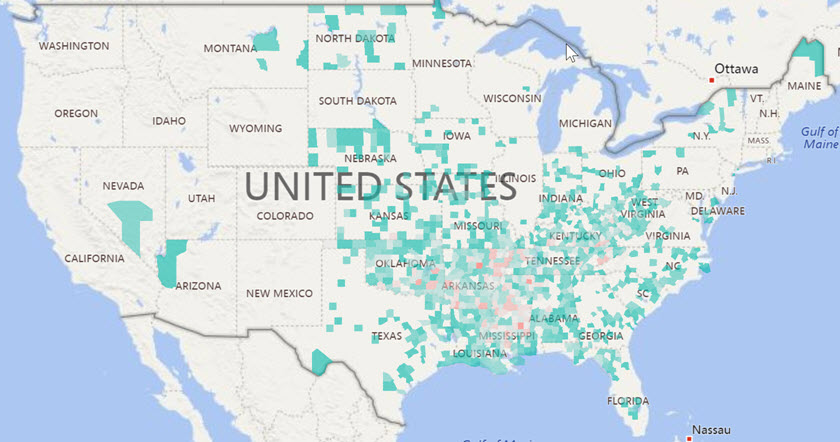
I love spring! As a warm weather person living in the Northeast, I can’t wait to get outside and be physically active. While many are like me, still 29% of the U.S. remains by and large physically inactive and it is very regionally concentrated. The County Health Rankings uses a measure…
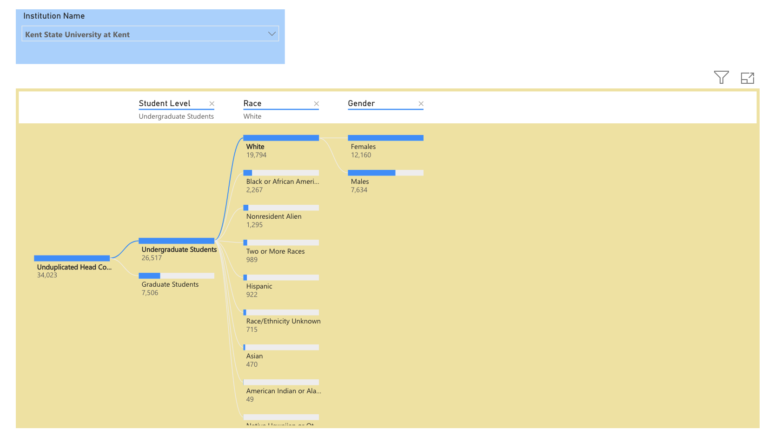
New Microsoft® Power BI Visual Dynamically Analyzes Categorical Data Like fashion goes in and out of style, so do visual ways of exploring data. Several decades ago I worked with a visual called the Decomposition Tree from an upstart company Proclarity from Boise, Idaho to analyze multi-dimensional data. That company…
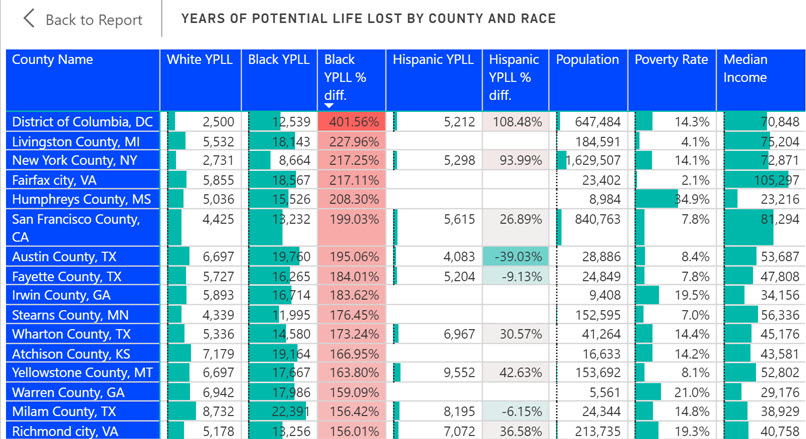
County Health Rankings has always used Premature Death as a measure in deriving its ranking formula. Years of Potential Life Lost Before Age 75 (or YPLL) counts as 50% of the Health Outcomes score. Every death occurring before the age of 75 contributes to the total number of years of potential…