College Building Boom Approaches $1 Trillion

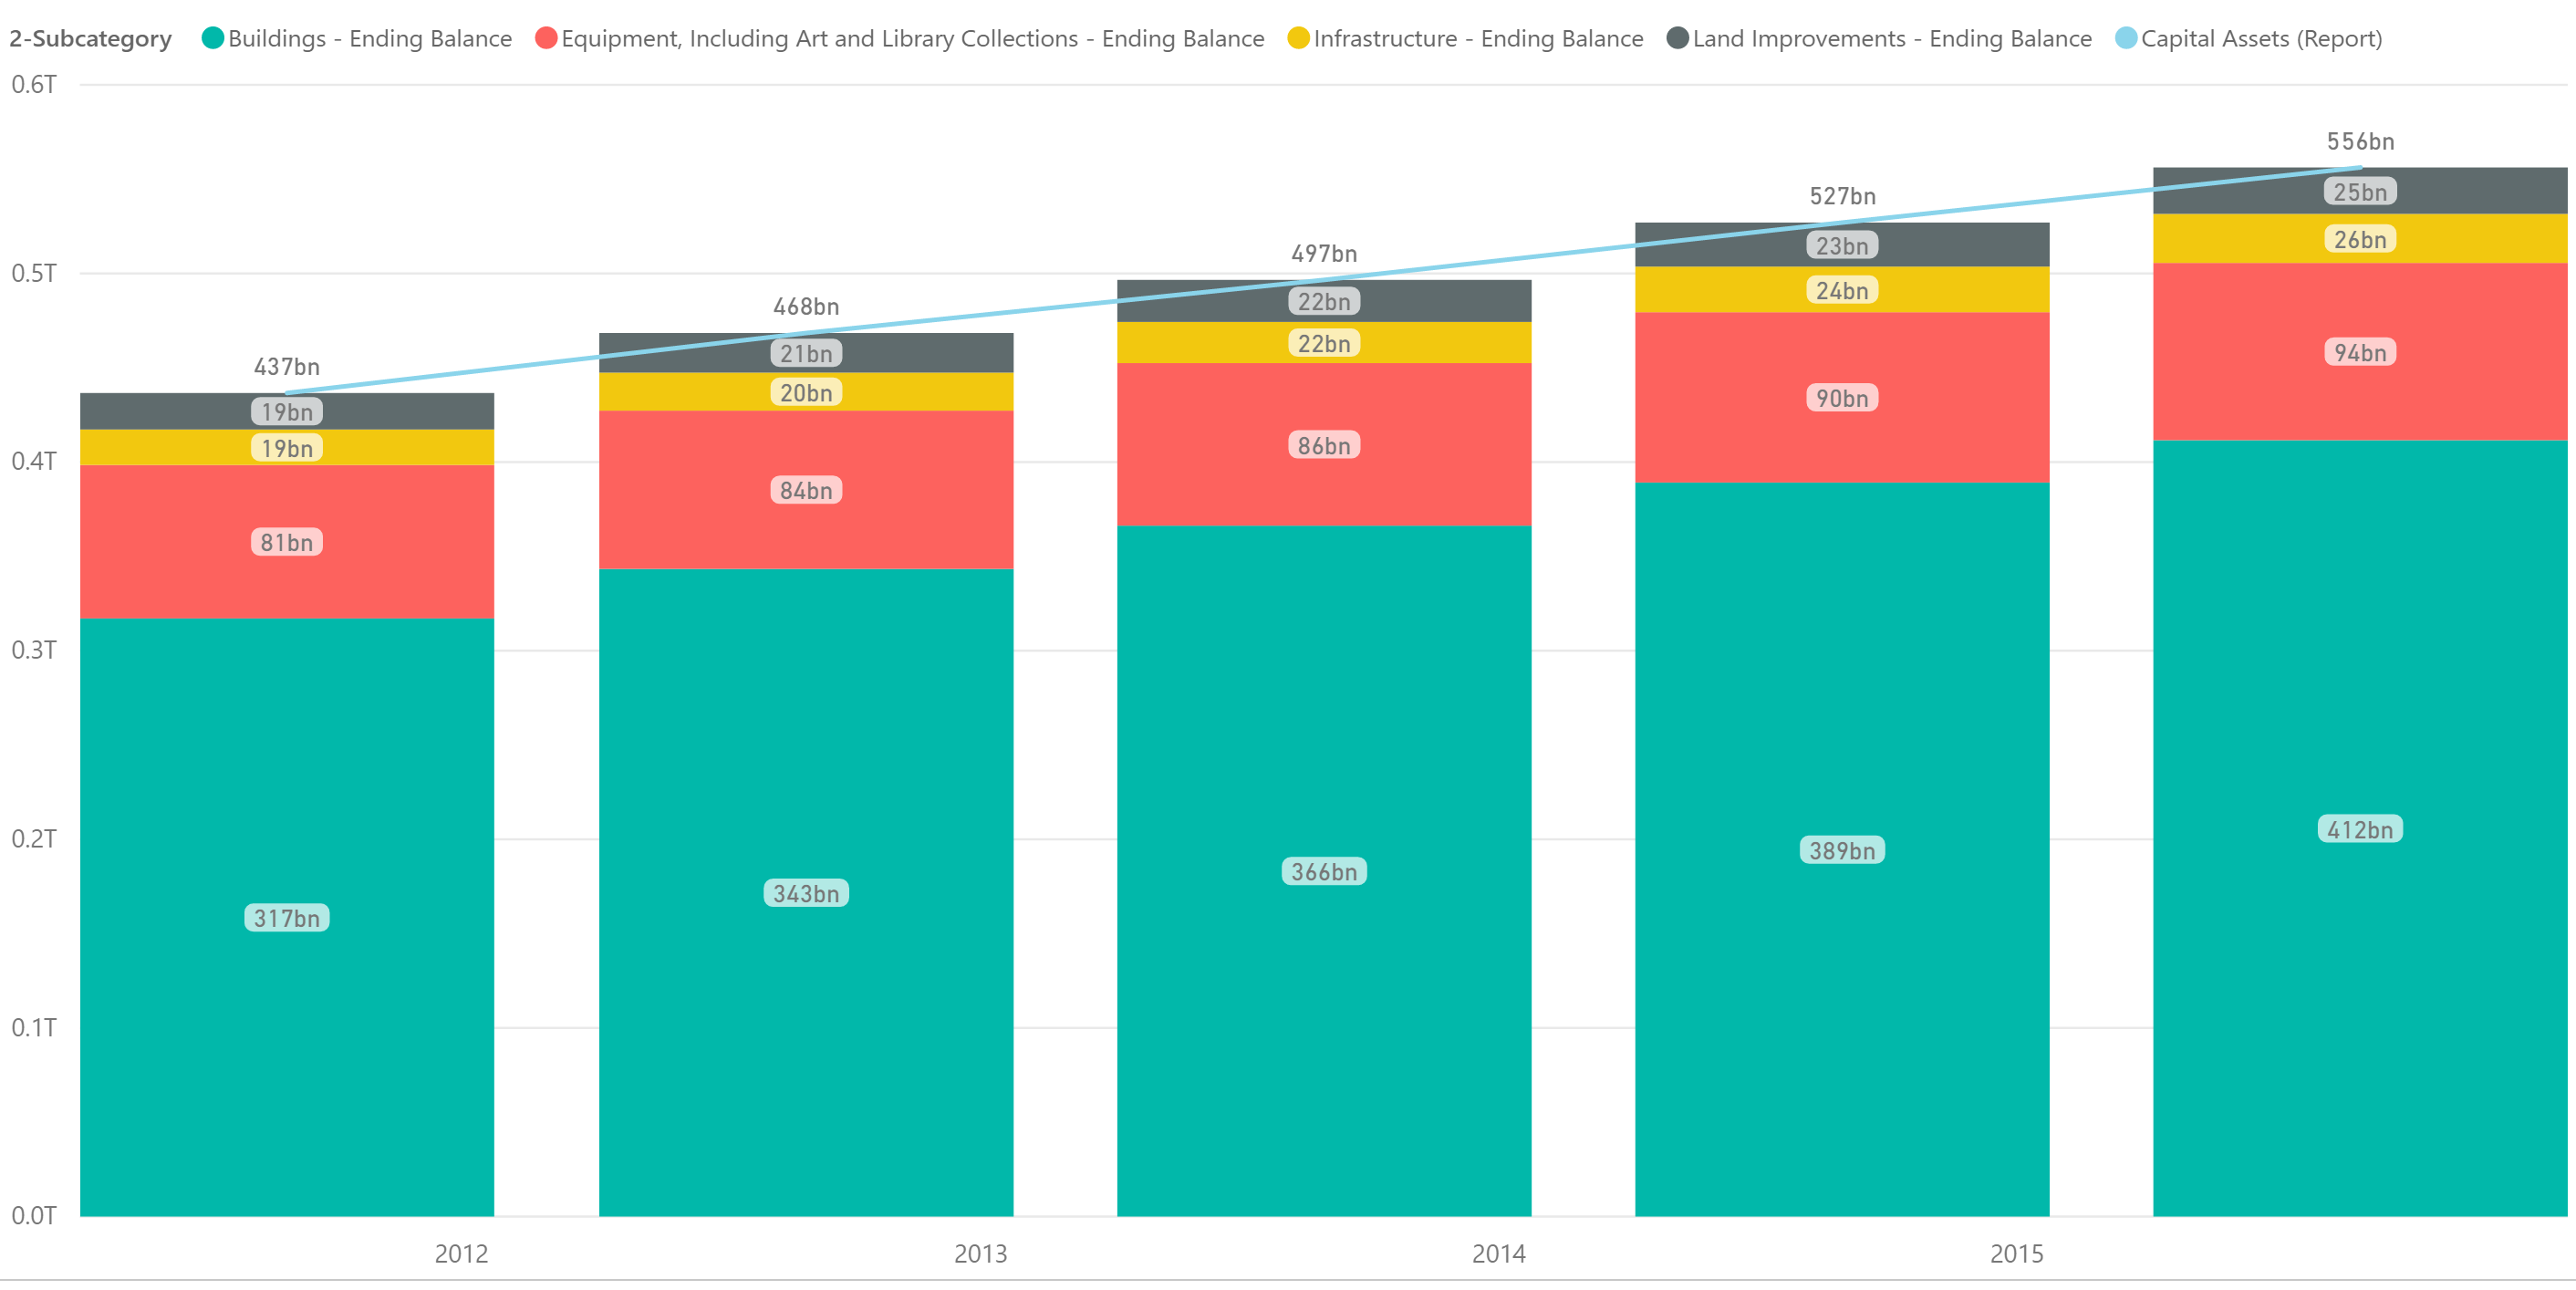
Postsecondary institutions continue to invest heavily in capital assets and the cumulative investment across public and private institutions has crossed $900 billion, an increase of 27% over a five-year period. The capital investment growth rates are almost identical for both public institutions and private non-profit institutions as noted in the visuals below. For-profit private institutions, which are not required to disclose asset detail, are flat over the same five-year period at roughly $8 billion. We crunched the numbers using the new Finance Interactive, which we anticipate will be available next week. 


Public Institutions


 Private Non-Profit Institutions


Roughly 75% of the capital assets are invested in buildings with equipment, including art and library collections taking up most of the balance. 


Share This Story

Similar Posts

  • Inpatient vs. Outpatient – What the Numbers Show

    Analysts in health care don’t agree in unanimity very often, but most seem to agree that there will continue to be a quantum shift in healthcare from inpatient to outpatient. In this two part series, we will attempt to quantify and support this important trend. We utilized the Beds and…

  • Powerball and Endowment Wealth per Student

    Large dollars tend to attract many of us. That is why the Powerball attracted so many people at the tidy sum of 1.3 billion. Yet the larger the number, the more people participate. Someone had the brilliant idea of distributing Powerball winnings to everyone in the country thinking it would…

  • CDC Publishes 2016 Natality (Births) Data

    The CDC recently released updated Natality (Births) data for 2016. State laws require birth certificates to be completed for all births, and Federal law mandates national collection and publication of births and other vital statistics data. The National Vital Statistics System provides access to statistical information from birth certificates and CDC makes…

  • Tuition Bears Increasing Brunt of Higher Ed. Revenue

    In 2011, Tuition and Fees represented 20.6% of public institutional revenue. In 2015, it has increased to 24.25%. Most of the reshuffling of revenue has come from federal operating grants and contracts as noted by the graphs below. Interestingly, state appropriations have remained relatively constant. Similarly, non-profit institutions have seen tuition…