The Aging of Housing in America

They are building three new homes across from my house here in Northeast Ohio. It seems we are past the time of the severe slowdown of housing starts and there has been a mini-housing resurgence. Home inventory levels remain low. The problem is, like my new neighbors, new housing tends to be on vacant land.


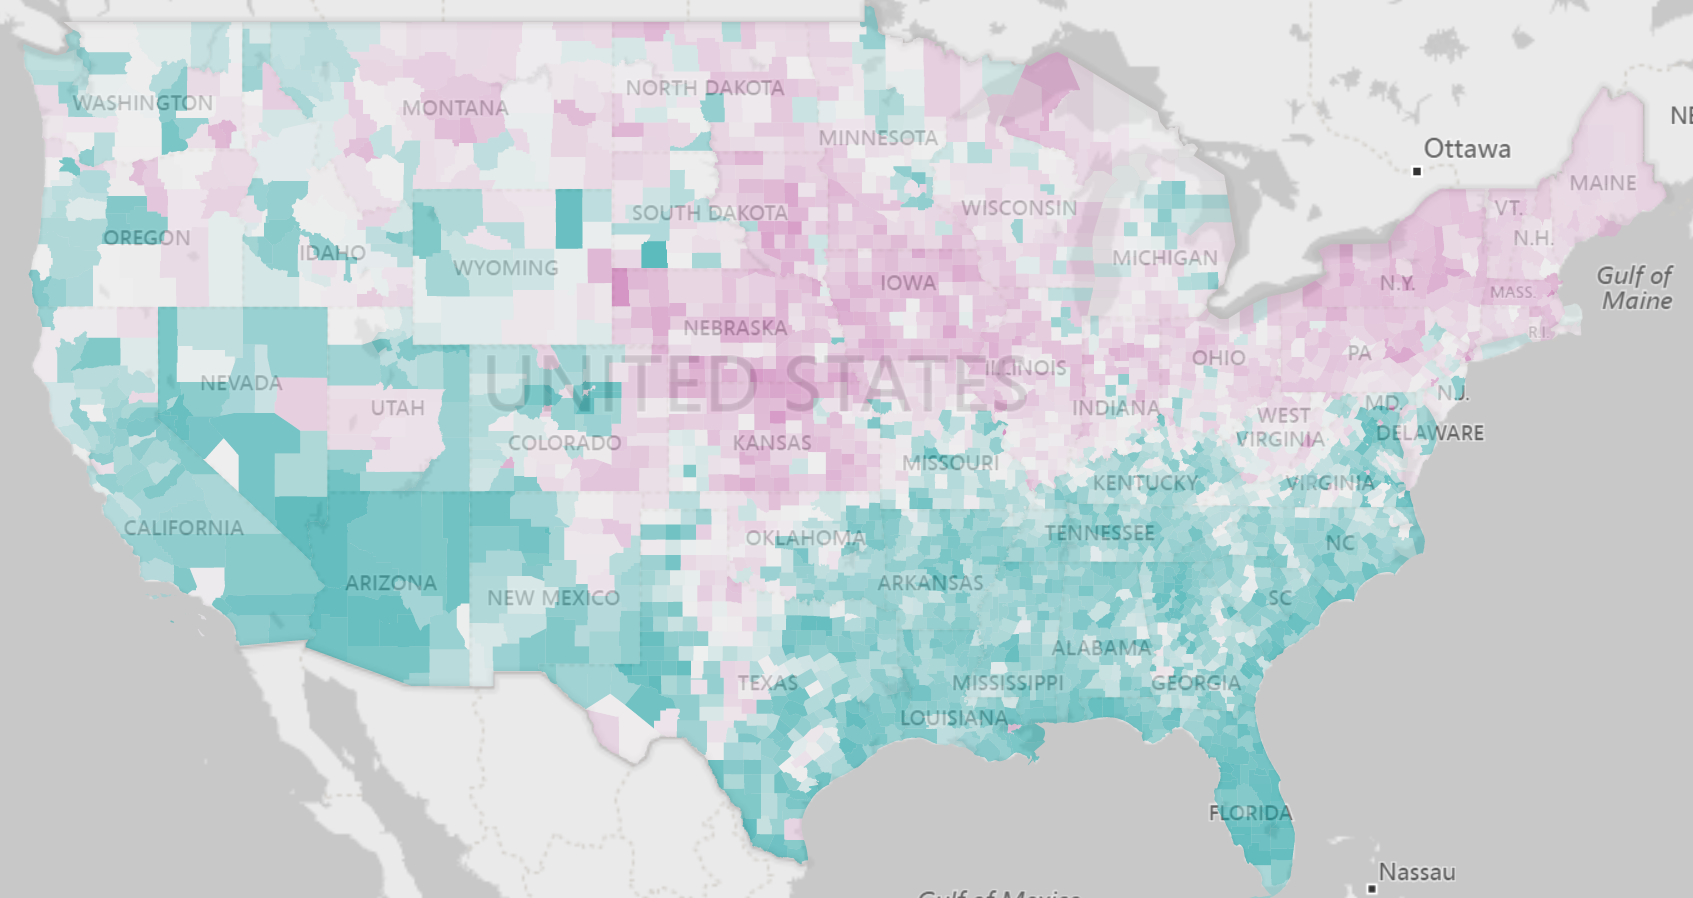
A very high percentage (12.9%) of homes still exist in the U.S. that were built prior to 1940. Next to homes built in the 1970’s, this is still one of the highest home categories based on age.  These homes primarily dot the landscape of our urban areas. There are 208 counties where 30% or more of the homes were built prior to 1940 and the weighted average population is just under 1 million. These homes also are heavily concentrated in the north as indicated by the magenta colors in the map below. 


There are numerous issues associated with older housing ranging from blight to upkeep to fire hazards. This article provides a nice overview.  


We have curated housing data from the American Community Survey into 25 indicators as part of the Population Analysis Interactive including age of structure.  We are committed to bringing disparate community data to life to inform community health and regional prosperity. 


Share This Story

Similar Posts

  • Visualizing Student Debt and Earnings

    Leveraging Scatterplots to Analyze the New College Scorecard Data There has always been a symbiotic relationship between student debt and student earnings. As student debt has creeped up in recent years, there has also been a data gap with post-graduation earnings. The most recent College Scorecard data is a first…

  • Infection Procedures Top Inpatient Volume Growth

    While Medicare inpatient procedure volume has remained flat since 2013, infections are a significant area of high volume change. The treemap below from the Inpatient Procedure Analysis Interactive shows the inpatient volume growth by procedure with color coding by volume change from 2013-2015 using the Medicare Provider and Analysis Review…

  • Student Debt Continues to Rise – Repayments Flat

    Last week, the Government Accountability Offices announced that the federal government will forgive a whopping $108 billion in student loans in the coming years. Prognosticators project a coming economic doom as the student debt crisis approaches mortgage meltdown proportions.   Last week we focused on the earnings of students six…

  • Violence Against Women Offenses Up 9.5%

    This is the third year that the Campus Safety and Security (CSS) data has released separate violence against women (VAW) offenses. This data captures three types of offenses; domestic violence, dating violence, and stalking and analyzes it for both on campus and off campus locations. Overall, there were 16,183 VAW…

  • Hot Jobs, Growing Wages, and Weird Titles

    I love looking at the Bureau of Labor Statistics Occupational Employment Statistics data. This data produces employment and wage estimates annually for over 800 occupations and estimates for states and metropolitan areas. I especially enjoy looking at this data from both a job growth and a wage growth perspective. That…

  • Degrees, Jobs, and Crosswalks

    My daughter has a Bachelor’s Degree in Fine Arts with a concentration in Cartooning and Illustration. Today, she is a quality assurance manager for a software company. I am very glad that her career has morphed into a burgeoning field because it was very clear to me that it would…