Has Distance Education Hit Its Peak?

Programs offered through distance education or what we might conventionally refer to as online programs actually declined as a percentage of all programs from 10.8% to 10.5% in 2017 and 2016 respectively. This was the first time that distance education has actually declined since this data started being collected by IPEDS in 2013. Further, the number of programs being offered by institution and 6 digit CIP combination declined from 21,748 to 21,339. Not much of a decline, but a decline nevertheless.


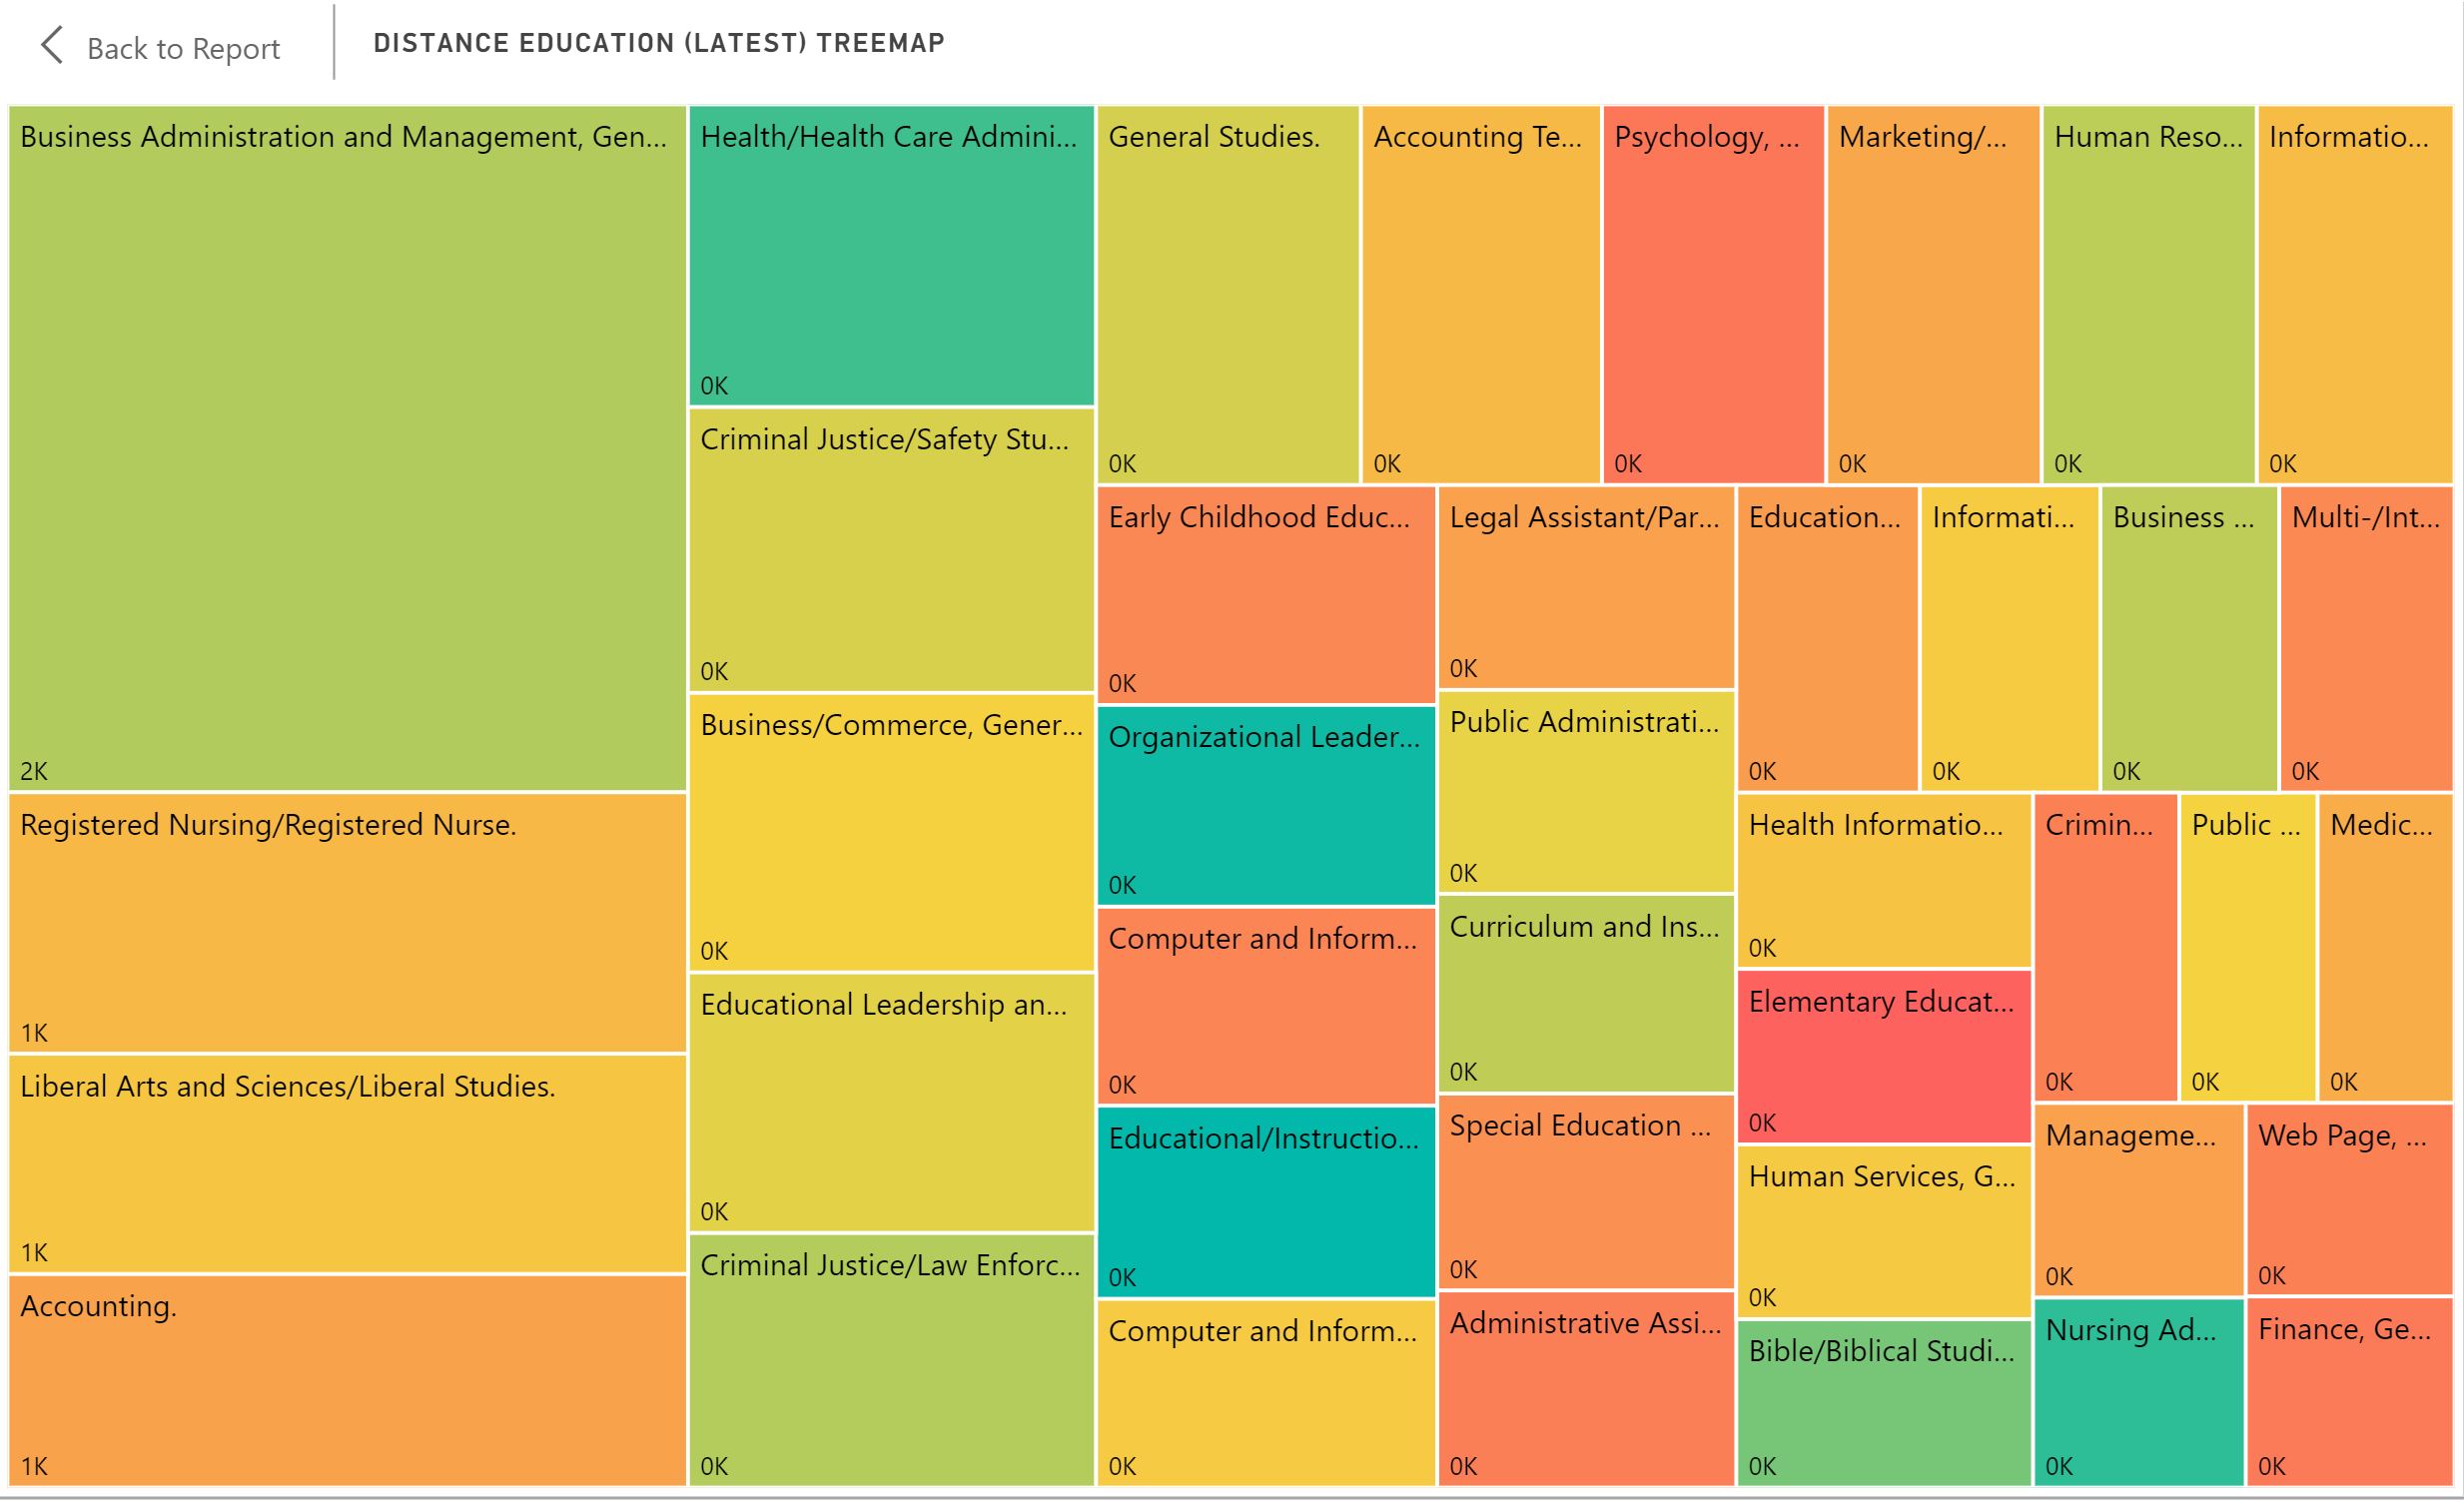
It appears that the original lure of distance education seems to have worn off somewhat and whatever works, works well. Whatever is not working is being phased out. Business Management continues to have the highest absolute number of distance education programs, but it is not the highest percentage of programs. The highest percentage of programs offered through distance education is in Organizational Leadership and Educational/Instructional Technology at over 34%. Nursing Administration and Health Care Administration are also high concentrations of distance education at around 31%.


The treemap below shows the distribution of the largest distance education programs (screened for minimum of 150 programs). The size is the raw number of programs while the color is the percentage offered through distance education (blue being highest and red being lowest on diverging scale). 


Share This Story

Similar Posts

  • Villanova vs. Michigan in Athletic Costs

    Villanova clearly dominated Michigan on the basketball court and has now won the NCAA Men’s basketball tournament two of the last three years. But how has that success translated to other sports and to the athletic costs in general.    The Equity in Athletics data is released annually by the…

  • Inpatient vs. Outpatient – What the Numbers Show

    Analysts in health care don’t agree in unanimity very often, but most seem to agree that there will continue to be a quantum shift in healthcare from inpatient to outpatient. In this two part series, we will attempt to quantify and support this important trend. We utilized the Beds and…

  • Room and Board Cost Increases Slowing

    After three straight years of 3-5% increases, room and board annual growth has finally slowed to a more pedestrian 2-3%. In recent years, universities have invested heavily in on-campus facilities and presumably passed these costs to the students at a rate greater than inflation. One administrator once told me that on-campus facilities…

  • What is the Newly Released Carnegie Data?

    The Carnegie Classification™ has been the major institutional framework for describing higher education institutions since 1970. This classification system comes out approximately every five years with the latest rendition released on February 1, 2016. This release represents the initial data provided by the Indiana University Bloomington Center for Postsecondary Research…

  • Hot Jobs, Growing Wages, and Weird Titles

    I love looking at the Bureau of Labor Statistics Occupational Employment Statistics data. This data produces employment and wage estimates annually for over 800 occupations and estimates for states and metropolitan areas. I especially enjoy looking at this data from both a job growth and a wage growth perspective. That…

  • Endowments per Student Down in 2016

    How financially fit is your institution? One of the measures that Forbes has used in assessing the financial fitness of postsecondary institutions is endowment assets per FTE. This metric takes the value of endowment assets at the end of the year and divides it by the number of FTE’s. In…