Critical Infrastructure Accounts for 60% of Jobs as the Rest Open Up
The stay-at-home orders under the COVID-19 pandemic separated “essential” from “non-essential”. Businesses deemed essential stayed open. Those that were not essential shut down. Sometimes those lines were very blurred with individual states and even communities making those choices unilaterally.
Fortunately the LMI Institute and C2ER have produced a list of Standard Occupation Classification (SOC) codes connected to critical infrastructure (e.g., essential) industries. The list is based on the Department of Homeland Security’s guidance for identifying the critical infrastructure workforce during COVID-19 response and includes occupations connected to medical and healthcare, telecommunications, information technology systems, defense, food and agriculture, transportation and logistics, energy, water and wastewater, law enforcement, and public works industries. According to this federal standard, 55% of the total U.S. workforce is deemed essential. If you are a glass half-empty person, that means 45% of the workforce is non-essential.
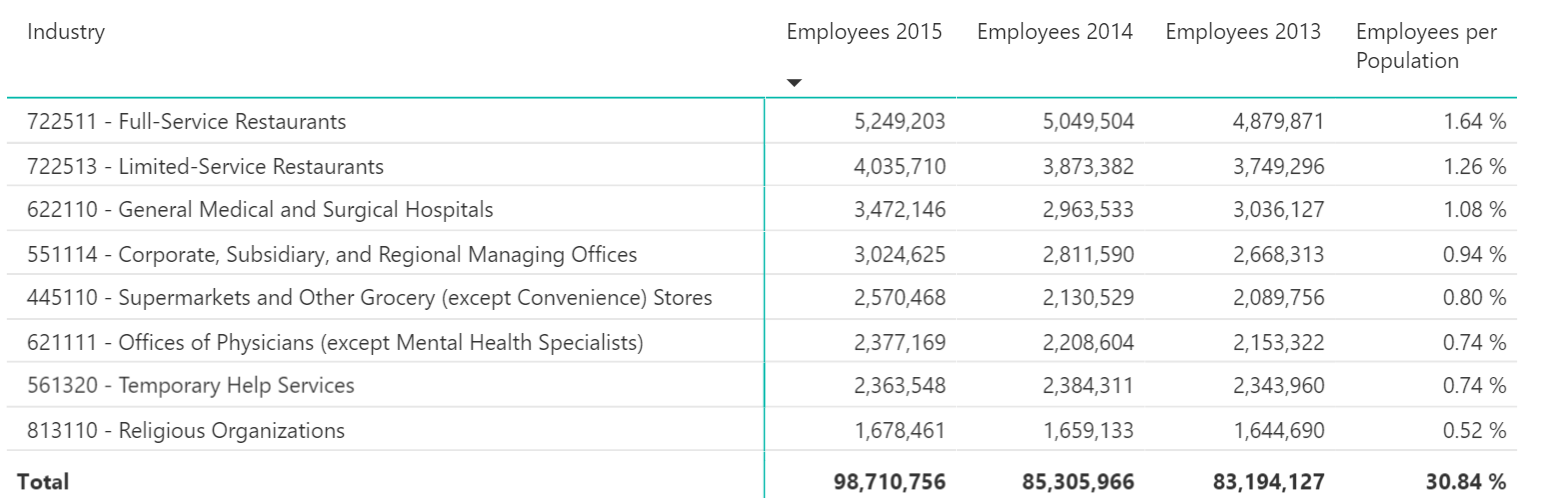
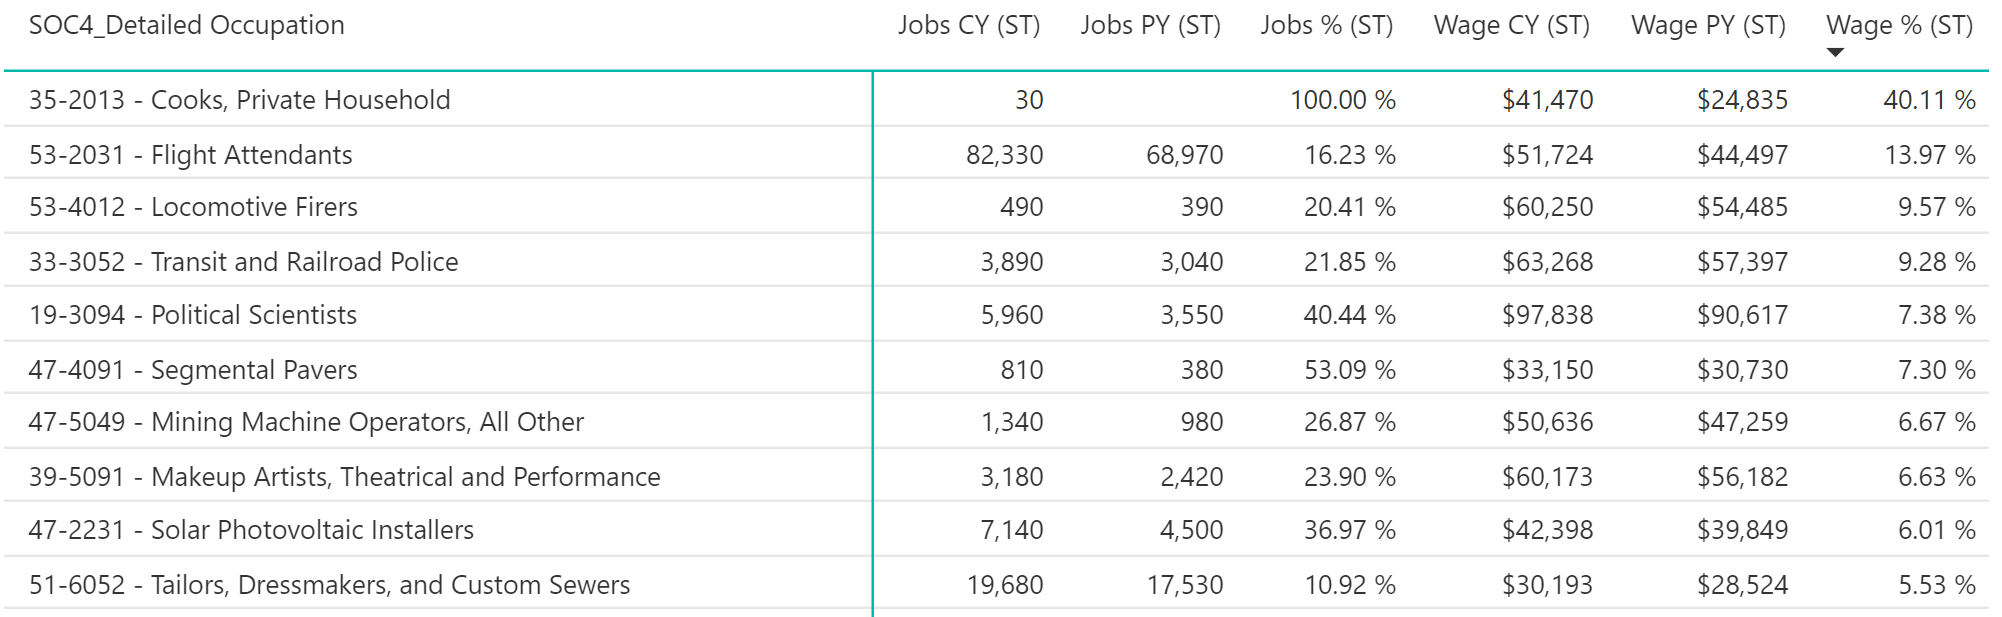
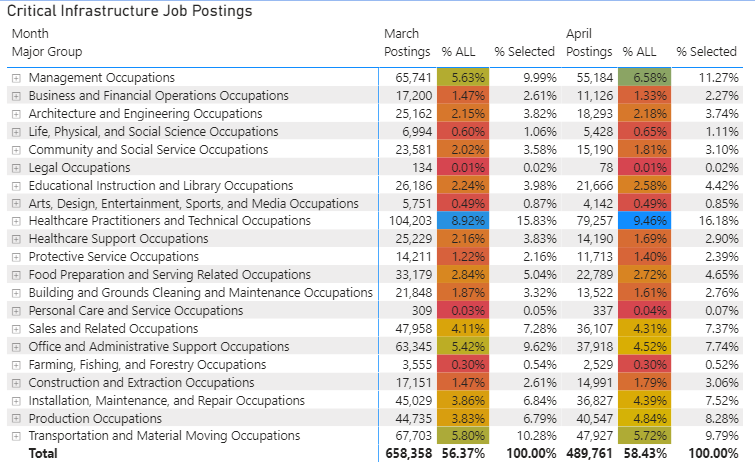
The repercussions of the essential/non-essential argument will outlast the gradual reopening of the labor market. For example, April job posting activity while down 28% from March showed strong growth in certain occupations. Healthcare workers were nearly 10% of all job postings but essential personal service job postings were non-existent. In a “normal” market, these jobs would be nearly 5% of the jobs posted. The table below shows the distribution of essential job postings as a percentage of all posted jobs and as a percentage within the critical infrastructure category. Critical infrastructure is a simple filter within the Insight for Work Interactive.

Next Jobs Report Webinar – June 4, 2020
I am excited to see what happens with May job postings activity as we slowly emerge from this crisis. We will provide a sneak peek of this in our next Jobs Report webinar on June 4, 2020. Please register now to attend this free webinar.
About Public Insight
Public Insight transforms the islands of public data into actionable insights with analytic datasets and Microsoft® Power BI to better understand your industry and market. Insight for Work is a labor market analysis service and dataset that provides a snapshot of current job postings and broader labor trends for assessing programs and staffing that meet market demand and skill requirements. Insight for Higher Education is an easy-to-use executive planning and analysis application for benchmarking higher education institutions across a wide range of topical areas such as enrollment, graduation rates, degrees awarded, and staffing. Request a 15-day free trial to explore any of our solutions.