Distance Education is now 12.3% of all programs and up 7.6% in 2018
Social distancing, at least for now, is the new normal and along with it comes distance education. Each year we look at what the data is telling us for distance education programs. Last year, I suggested that it appeared that distance education may have hit its peak as the distance education percentage had flattened after years of increases. This sparked a rather vigorous online debate. I may have been premature.
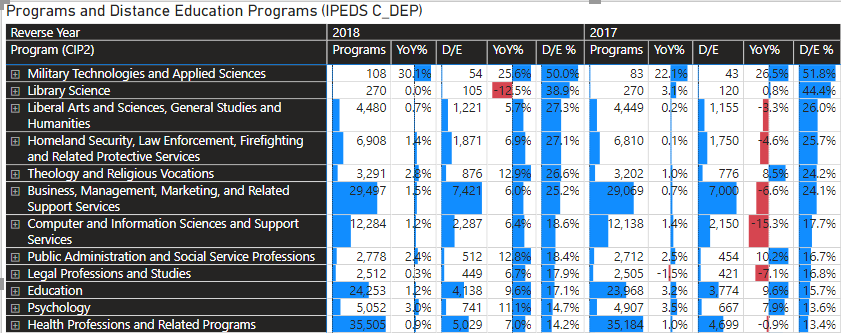
The newest data from IPEDS shows that Distance Education programs as a percentage of all programs is up 7.6% to 12.3% of all programs. These are the highest levels of distance education coverage yet. The programs that have done historically well in distance education continue to grow at a rapid pace. For example, homeland security and related areas is 27.1% of all programs and grew 6.9% in 2018. Education categories grew 9.6%.
What is more encouraging perhaps considering a global pandemic is the distance education growth in areas that we may not historically associate with distance education. For example, STEM related fields have had minimal distance education coverage even before the recent shock events. There is evidence that this is changing (albeit from a small sample size). Physical and Biological Sciences for example are up 23.2% and 11.1% respectively. Trade related professions are up 31.6%. These areas overall have very little distance education coverage but may be shocked into a more creative approach that may hold true even after this crisis has passed.
We have created a free Interactive that allows you to navigate programs and distance education programs at the CIP2 and CIP6 level. We compute the distance education percentage as well as the year-over-year change in distance education coverage. You can further filter the results by award level. The Insight for Higher Education Interactive provides further options to break down this data by institution and other criteria.
About Public Insight
Public Insight transforms the islands of public data into actionable insights with analytic datasets and Microsoft® Power BI to better understand your industry and market. Insight for Higher Education is an easy-to-use executive planning and analysis application for benchmarking higher education institutions across a wide range of topical areas such as enrollment, graduation rates, degrees awarded, and staffing. Sign up to access a free Factbook Interactive or request a 15-day trial to explore how easy it is to navigate through public data.