According to the Institute for College Access and Success, seven in 10 seniors (69%) who graduated from public and nonprofit colleges in 2014 had student loan debt, with an average of $28,950 per borrower. Over the last decade—from 2004 to 2014—the share of graduates with debt rose modestly (from 65% to 69%) while average debt at graduation rose at more than twice the rate of inflation.
The new College Scorecard data released in September provides a glimpse as to how students are doing at repaying the debt. The College Scorecard is the first national attempt to cross-link various federal agency databases to paint a picture of how colleges are doing in preparing students for careers. The National Student Loan Data System provides one, three, five, and seven-year repayment rates. Repayment rates are defined as being able to pay down at least $1 in principal. This metric is fundamentally different than student loan default rates which are provided by Federal Student Aid. It is also limited to those students who received subsidized loans and does not attempt to cover all loan borrowing activity.

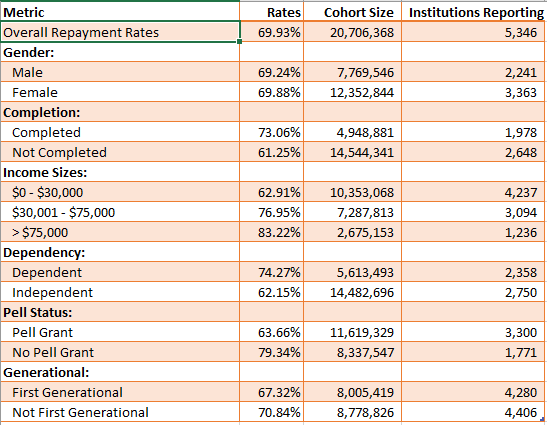
We downloaded from Public Insight the seven-year repayment rates for the last reported fiscal year of June 30, 2013 for 5,346 reporting institutions. The College Scorecard data provides a number of helpful breakdowns based on information supplied on the FAFSA form. We looked also at characteristics of the colleges themselves such as Carnegie Classification, size, and whether they offered certain services such as career counseling and employment services. A summary of the overall averages is reported below along with the number of students in the cohort and the number of institutions reporting the metric. Keep in mind that categorical breakdowns for many institutions are suppressed if the cohort reporting size is too small.

• Little difference between male and female repayment rates
• Completers are much more likely to pay down loans than non-completers
• Repayment rates rise as income post-graduation rises
• Dependent students are much more likely to pay down loans than independent students (more family money to support students)
• Students who received Pell grants are much less likely to pay down loans than those who don’t receive Pell grants (this is likely a function of the socioeconomic background of these students)
• First generational students are less likely to pay down loans than multi-generational students
Our institutional analysis shows that services such as career counseling and employment services seem to have an impact on the likelihood of loan repayments, but placement services do not seem to have an impact.
You can look at the College Scorecard loan repayment data by institution for free in Public Insight. You can also download a spreadsheet of all U.S. institutions and their seven-year repayment rates along with pivot tables for the various institutional characteristics by clicking HERE.