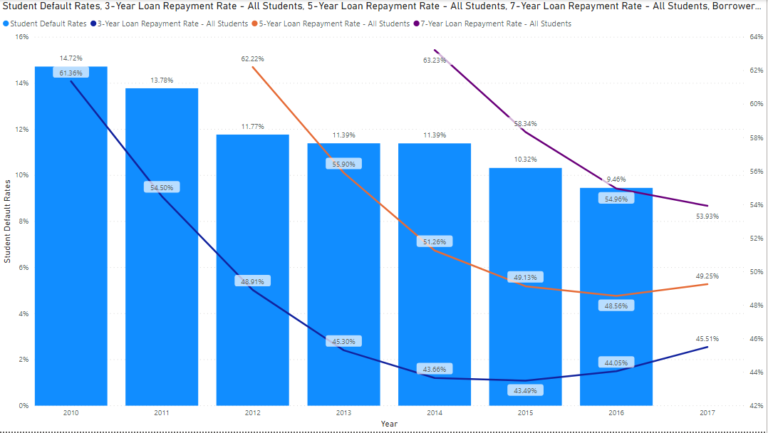
Despite an overall tepid rebound of jobs, the outlook for jobs in the healthcare field is expected to continue to be strong. According to the US Bureau of Labor Statistics, healthcare will generate 3.2 million new wage and salary jobs between 2008 and 2018, more than any other industry. Over the 2008-18 period, total employment of home health aides is projected to increase by 50 percent, medical assistants by 34 percent, physical therapist assistants by 33 percent, and physician assistants by 39 percent. Within the inpatient world, Registered Nursing (RN) is listed among the top occupations in terms of job growth through 2022. The RN workforce is expected to grow from 2.71 million in 2012 to 3.24 million in 2022, an increase of 526,800 or 19%. The Bureau also projects the need for 525,000 replacements nurses in the workforce bringing the total number of job openings for nurses due to growth and replacements to 1.05 million by 2022.
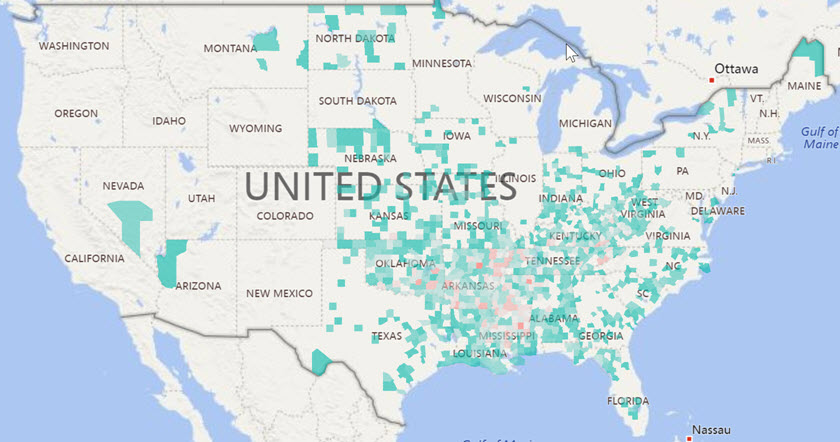
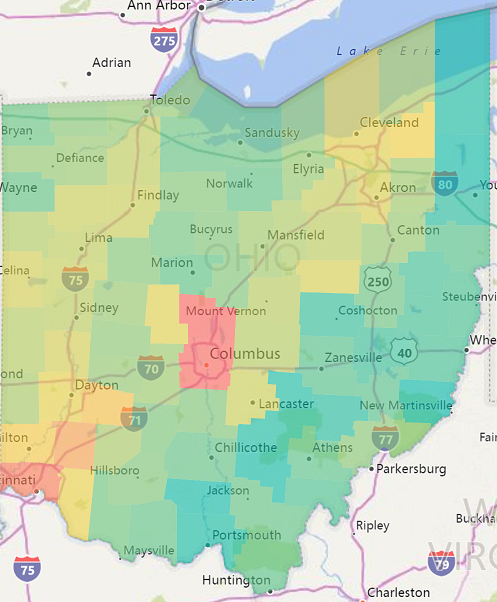
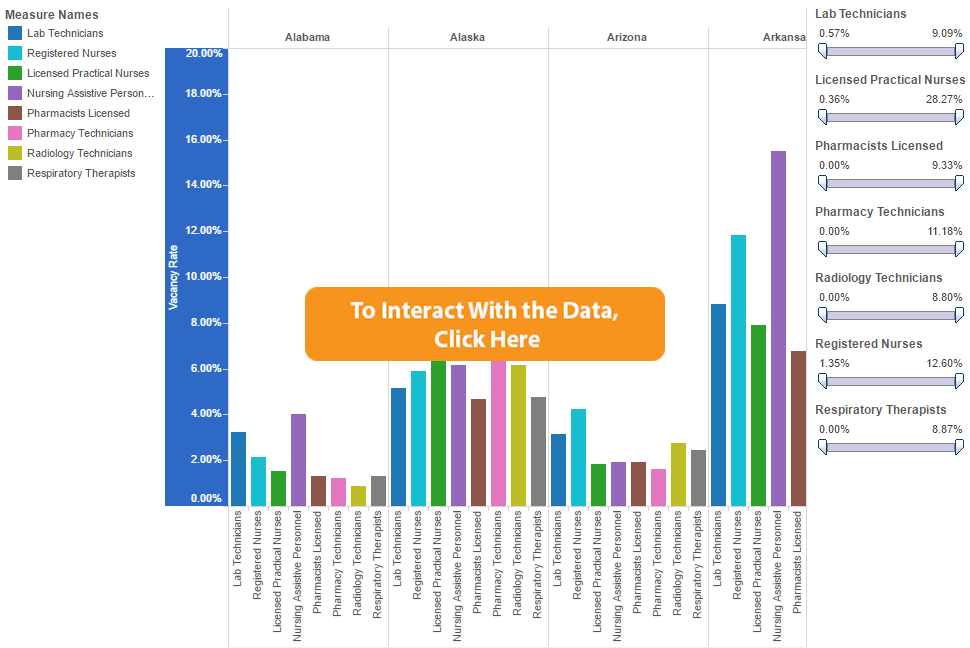
Staffing vacancy data from America’s hospitals seem to support the projections. The American Hospital Association® Annual Survey captures staffing vacancies by type of position as well as current FTE staff. We related the vacancies to the current staffing levels to arrive at a vacancy rate. We extracted the data by state using Public Insight Omniview and calculated the vacancy rate by position for each state. Vacancy rates range widely by state by position. For example, hospitals in the state of Connecticut show a summary vacancy rate for Licensed Practical Nurses of over 28%. The same state shows a vacancy rate of just over 6% for registered nurses. You can analyze the vacancy rate by state using the Tableau Public visualization we’ve created. You can zoom in on a particular state vacancy rate by using the sliders. To interact with the Tableau visualization and the data, click HERE.