When is Free Tuition Really Free?

The sticker pricing game has been in place a long time. No one ever pays full sticker price for items such as jewelry or cars. That is probably why University of Michigan came under scrutiny for its free tuition guarantee for families with income under $65,000. Cynics pointed this out as simply marketing hype.


It is hard to single out one line item like tuition in the overall costs of attendance. After all, costs of attendance are tuition plus expenses less grant and scholarship aid. Free tuition could be merely moving dollars from the discount bucket (i.e. aid) to the gross bucket (i.e tuition). Postsecondary institutions have longed been required to disclose net price and provide a pricing calculator on their web site.


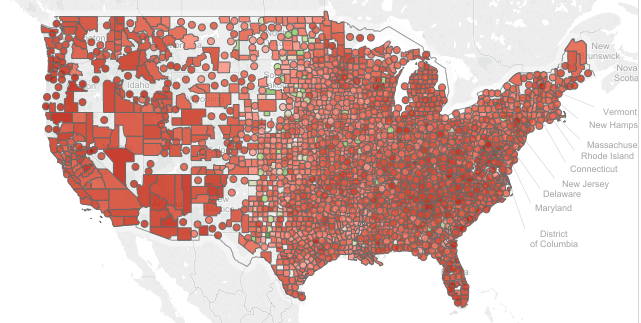
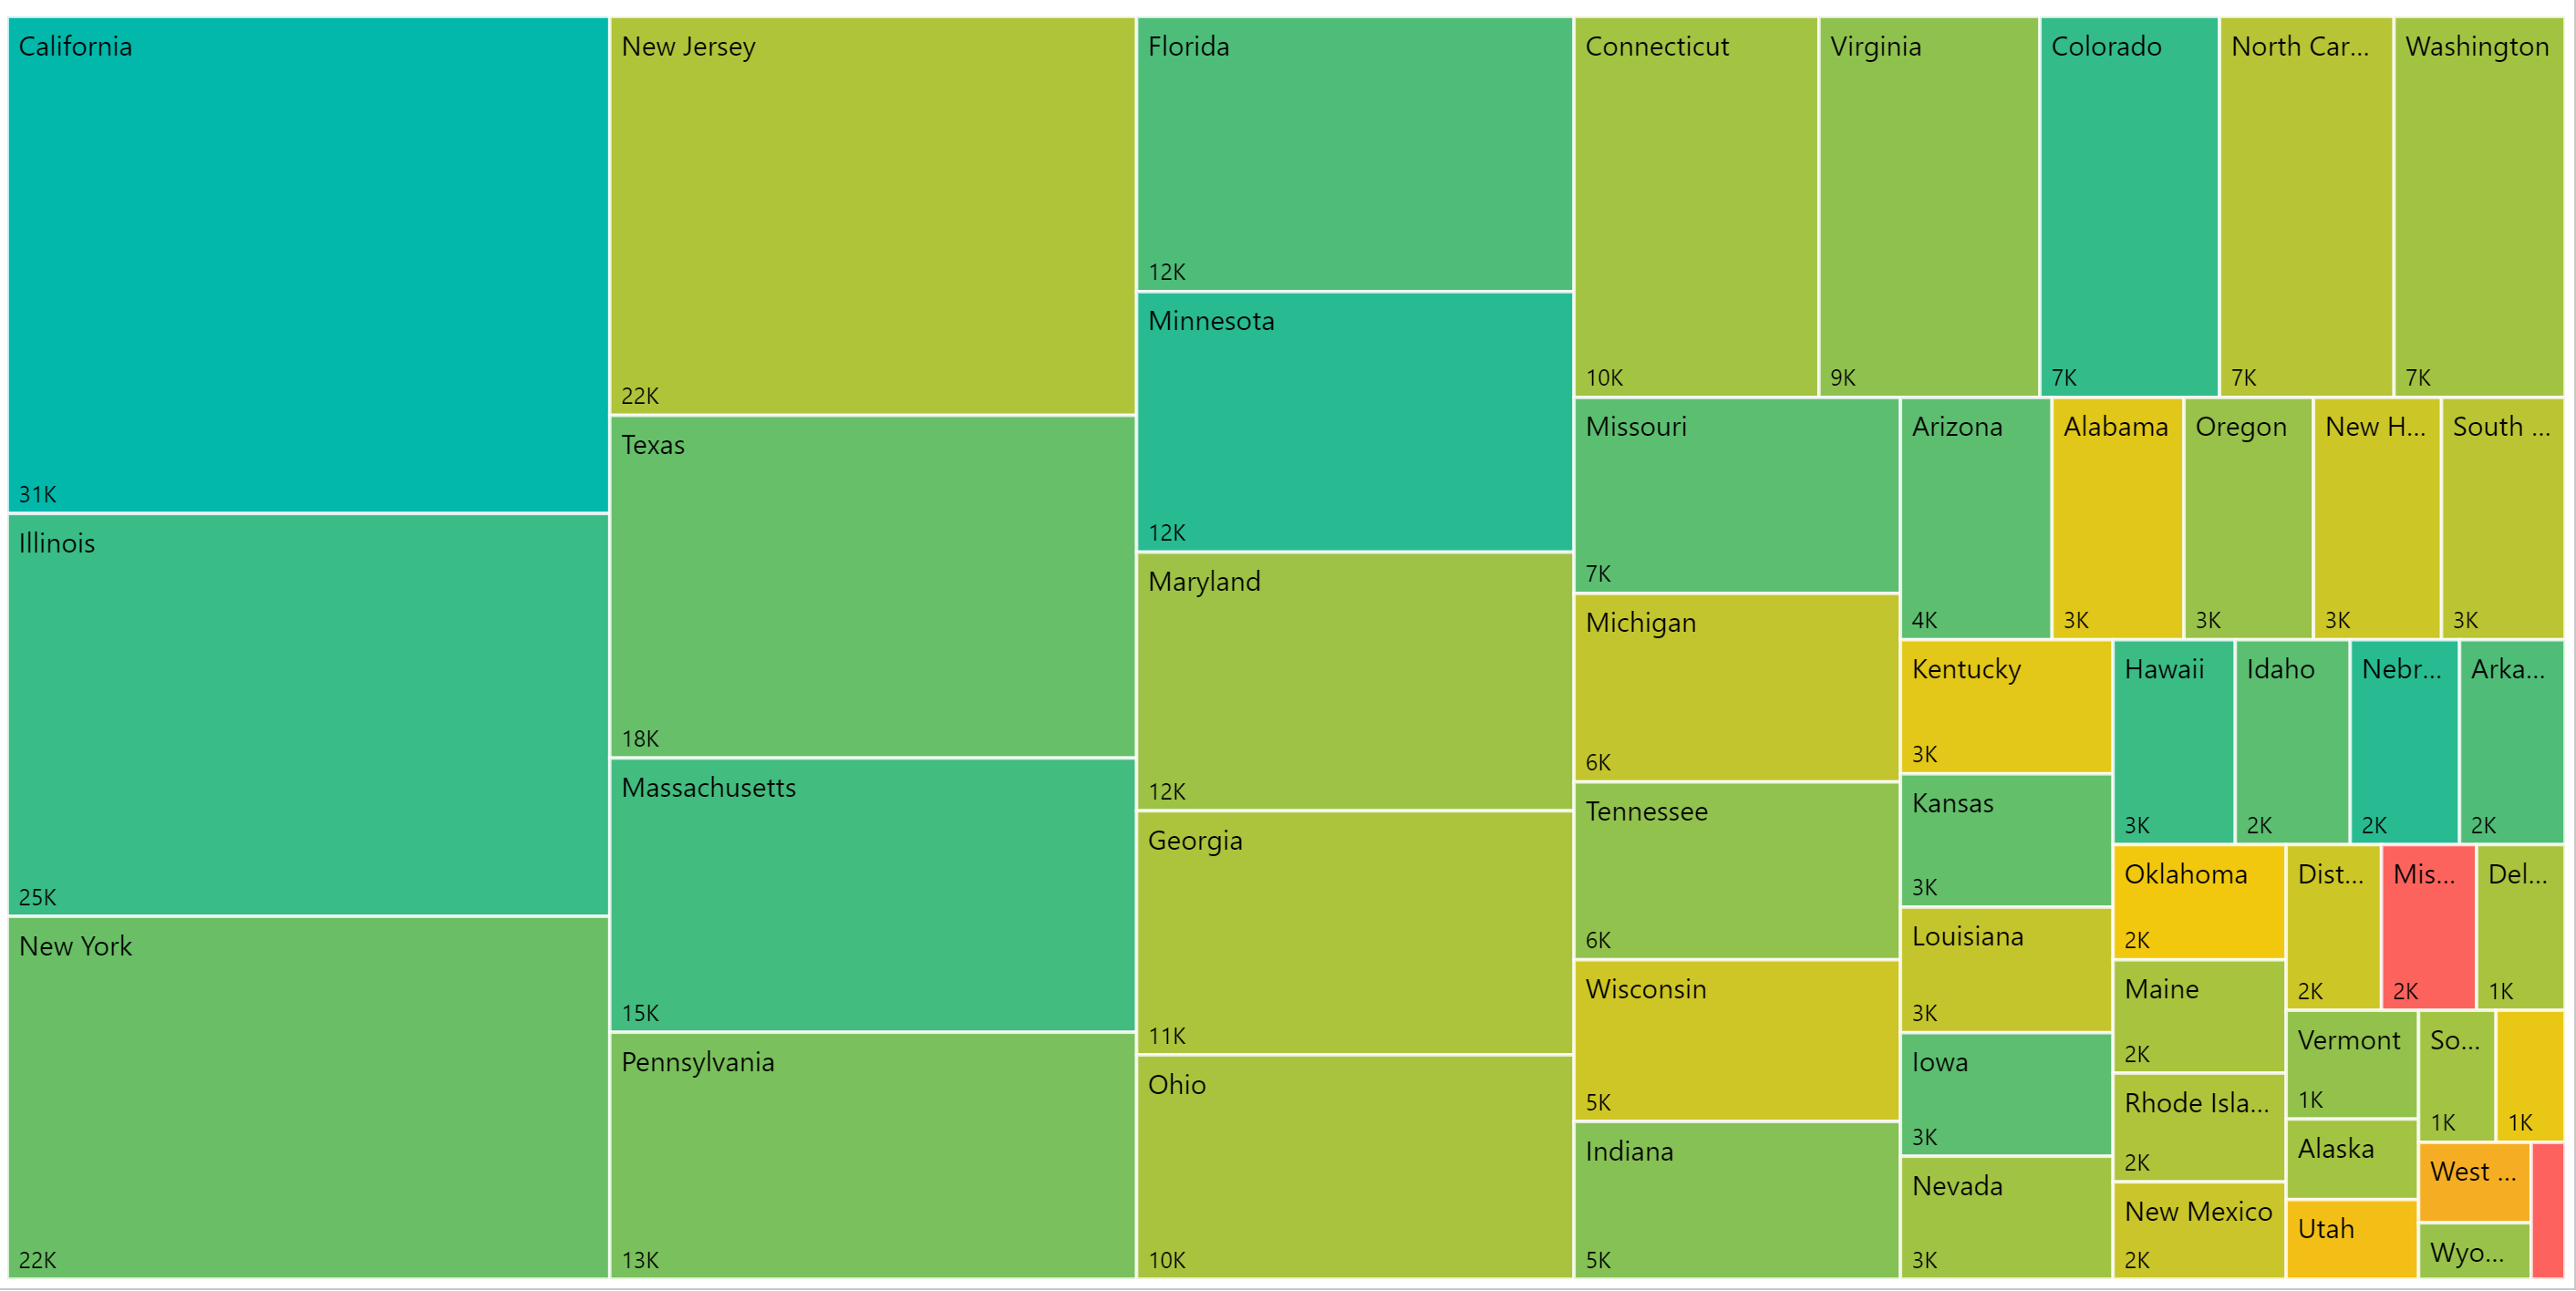
The new Public Insight Tuition and Pricing Interactive is designed to analyze the components of net price for the entire landscape of postsecondary institutions. Fees such as books and supplies, and room and board can range very widely.

  • On-campus expenses for University of Michigan are $13,956 compared to the average annual tuition of $14,401 for in-state students.

  • The average scholarship and grant aid for all students is $11,109.

  • However, the average for students with family income of less than $75,000 is $20,271.

So the grant and scholarship aid is actually greater than average annual tuition. In fact, tuition is becoming far less of an issue when factoring in the costs of education. In-state institutions such as Michigan have provided nearly 6.3 billion in total scholarships and aid for the year ended August, 2015 a jump of 6.4% in the past two years. Tuition during the past two years have been relatively flat during the period. 


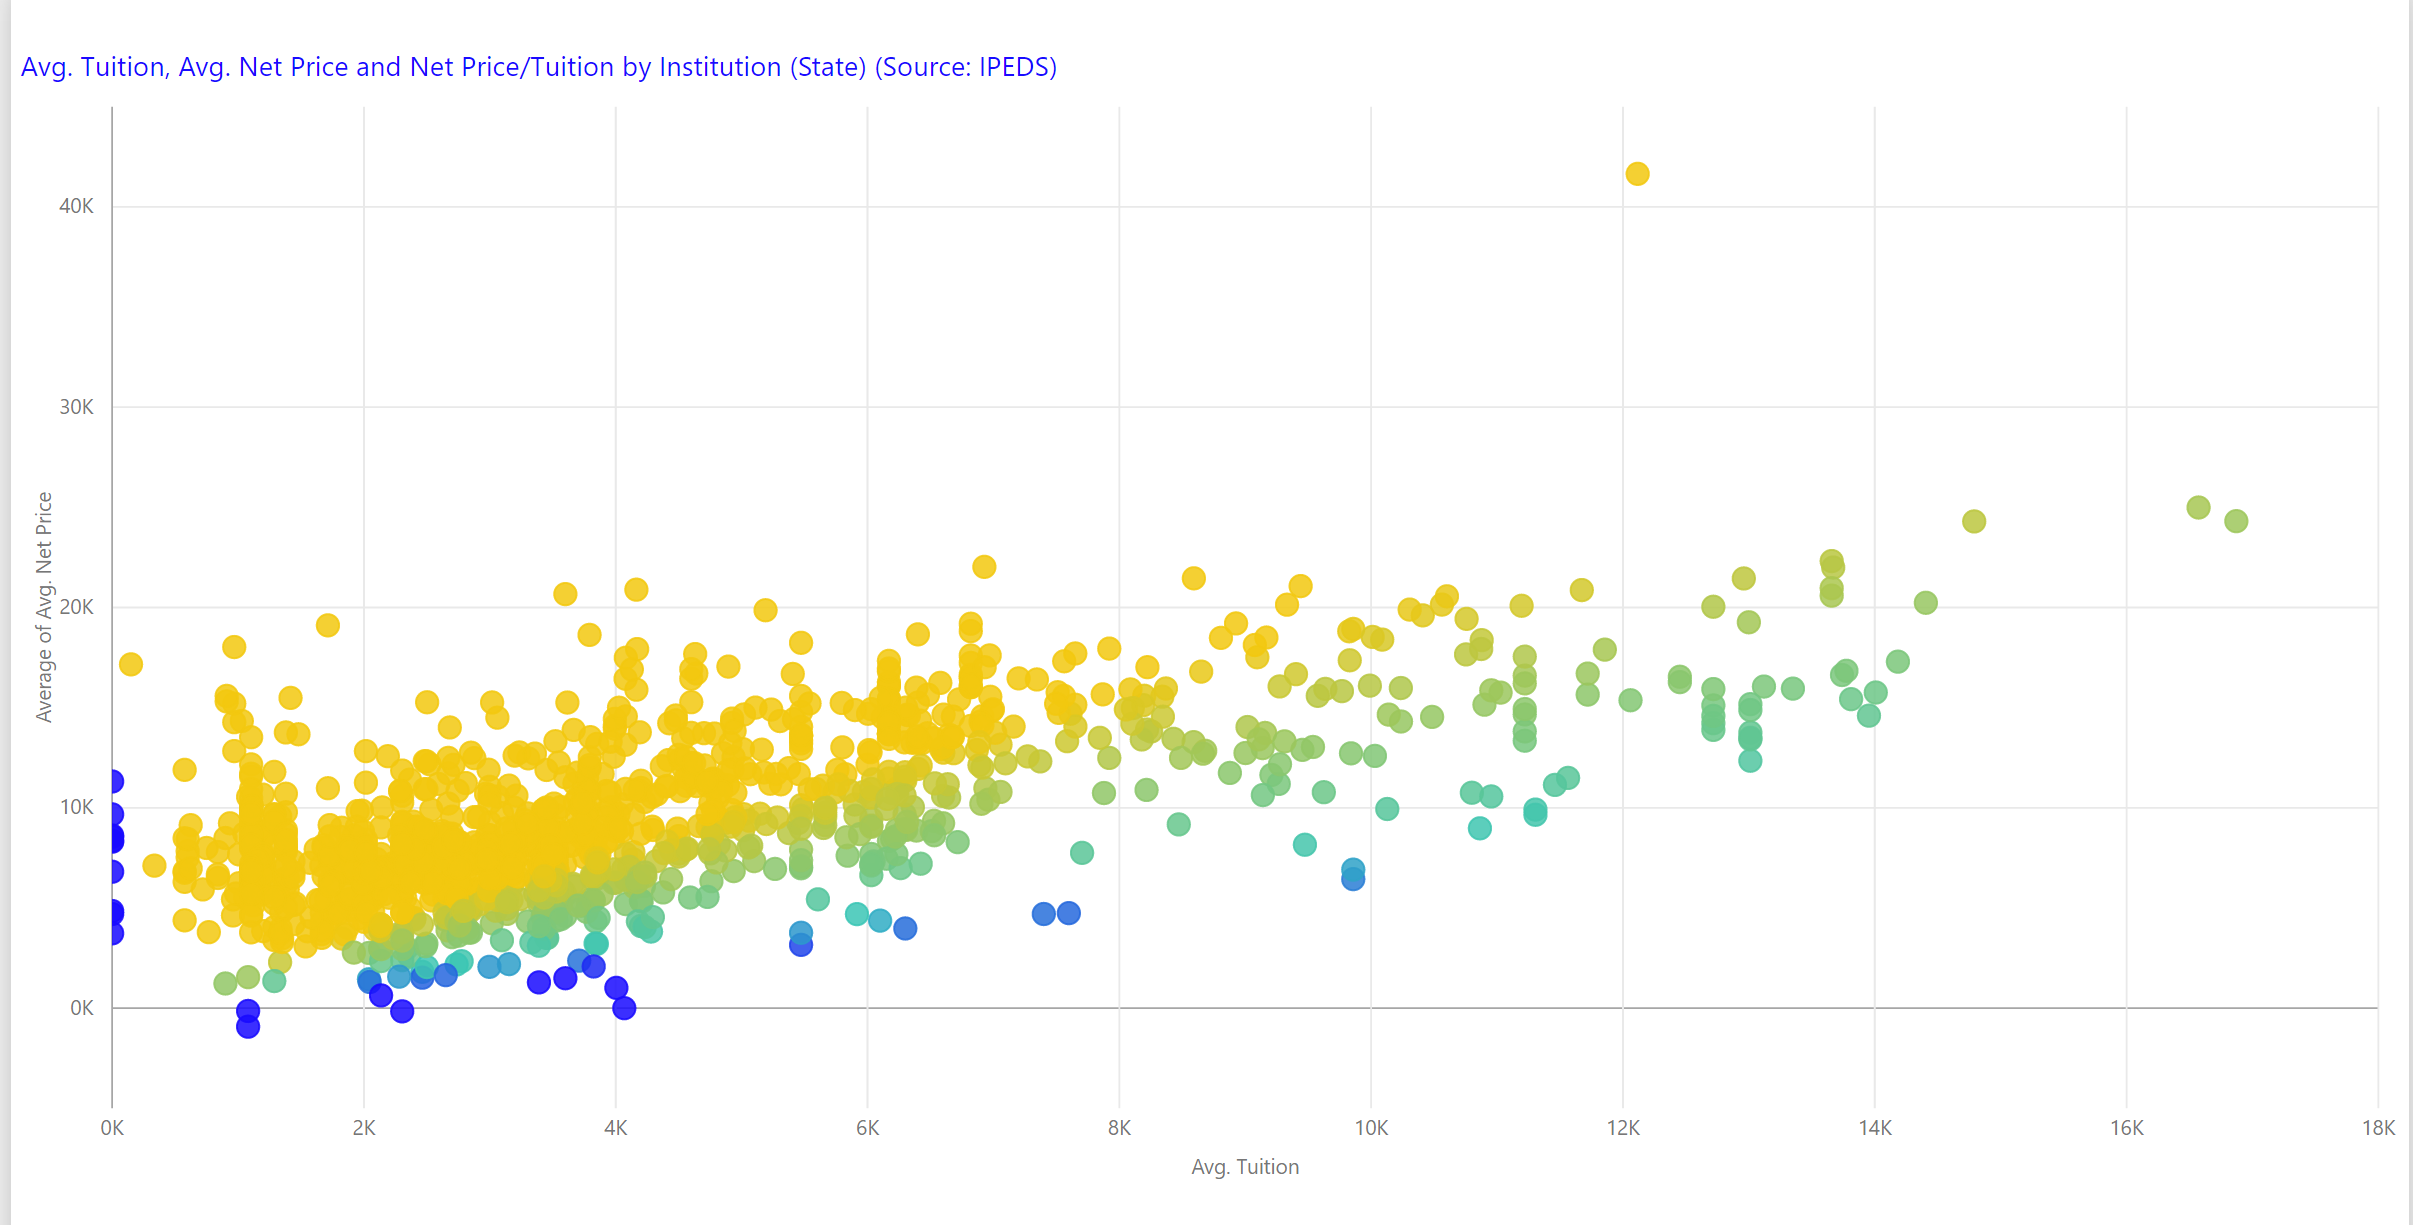
The scatterplot below shows state institutions net price against tuition. The institutions in gold have a higher net price than tuition meaning the costs of expenses exceed the scholarship and grant aid. While free tuition may be a matter of moving money around, it also could usher in a world of more transparency around the actual costs of attendance.



Share This Story

Similar Posts

  • Using AI to Break Down Head Count

    New Microsoft® Power BI Visual Dynamically Analyzes Categorical Data Like fashion goes in and out of style, so do visual ways of exploring data. Several decades ago I worked with a visual called the Decomposition Tree from an upstart company Proclarity from Boise, Idaho to analyze multi-dimensional data. That company…

  • Regional Variations in Opioid Prescribing Rates

    Given the state of the opioid crisis, any meaningful data is valuable. So when CMS released three years of Opioid Part D prescription data in November, we all rejoiced. CMS also released a mapping tool to analyze the data. While mapping tools can be effective, they can also get in…

  • Death Rates Rise Sharply for Millenials

    The new CDC mortality data continues to paint a rather grim picture. Last week we focused on the external causes of the rise in death rates. This week we analyzed the mortality (death) rate among age groups using over 1.8 billion data points over 17 years from the CDC. You…

  • College Building Boom Approaches $1 Trillion

    Postsecondary institutions continue to invest heavily in capital assets and the cumulative investment across public and private institutions has crossed $900 billion, an increase of 27% over a five-year period. The capital investment growth rates are almost identical for both public institutions and private non-profit institutions as noted in the…

  • What the Ascension – Presence Merger Reveals

    This week, Ascension Health acquired Presence Health, combining the largest Catholic-sponsored healthcare system in Illinois with the nation’s largest Catholic health system, the companies announced Tuesday. The acquisition is subject to regulatory approvals. The deal underscores a continued trend towards market consolidation.    It seems Ascension, at 141 hospitals, acquiring an…

  • Death Rate Continues to Inch Up

    The mortality (or death) rate increased nominally from 2016 to 2017 going from 844 to 849 deaths per 100,000. This probably is not earthshaking news but based on the overall crude rate, it has actually been increasing since 2009 as noted by the following graph.   Advances in medical care…