The Profile of the Five-Star CMS Hospital (First in a Series)

It is hard to believe but it has been about one year since the Centers for Medicare & Medicaid Services released its initial hospital rating system. At that time 102 hospitals earned the coveted five-star rating. The most recent ratings show 188 hospitals with the five-star rating out of roughly 3,500 hospitals. The rating system is still evolving and has received criticism across a number of fronts as penalizing urban hospitals.


We ran the numbers to see what the profile of the 188 five-star hospitals are. Using the Hospital Consumer Assessment (HCAHPS) Interactive blended with general survey data from the AHA Annual Survey Databaseā„¢, we were able to get a picture of what the five-star hospitals look like and where they are located. We constructed a ratio of five-star hospitals over all hospitals for various classifications.


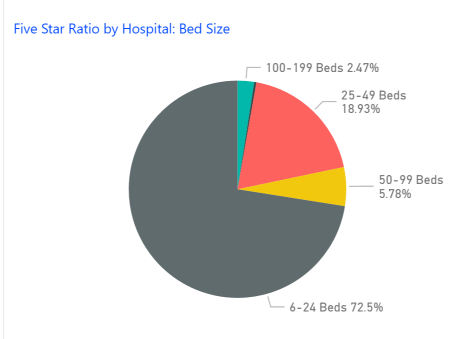
Five-Star Hospitals are Small

Of the 188 five-star hospitals, 144 of them are in hospitals with less than 50 beds. On the contrary, not a single hospital with more than 300 beds had a five-star rating. The following pie graph shows this discrepancy very starkly.


Five-Star Hospitals are Capitalistic

The 188 hospitals includes 26 that are owned by physicians which is 58% of all physician owned hospitals as noted in the table below. The list includes 38 hospitals that are private partnerships or 24% of all hospital partnerships. The worse five-star ratios? Non-profits which have less than 4% that are five-star hospitals.


Share This Story

Similar Posts

  • Rural Hospitals are Five-Star According to CMS

    Los Angeles County, CA and Cook County, IL (Chicago) have 117 CMS rated hospitals between them and over 15 million residents. Yet, there is not a single five-star hospital in either county. In this mini-series, we have examined the profile of the current 188 five-star hospitals as it marks its…

  • Have Student Debt Repayment Rates Bottomed?

    Student repayment rates continues to decline, although the trend seems to be slowing, according to the most recent College Scorecard data. This data measures repayment rates at 1,3,5, and 7 years. Repayment rates and default rates are very different. Repayment rates are the percentage of students who have made progress…

  • Inpatient vs. Outpatient – What the Numbers Show

    Analysts in health care don’t agree in unanimity very often, but most seem to agree that there will continue to be a quantum shift in healthcare from inpatient to outpatient. In this two part series, we will attempt to quantify and support this important trend. We utilized the Beds and…

  • EVICTED – The Impact of Housing Affordability

    I was in the Bay Area this week for a health technology conference at Stanford University. I took Lyft back and forth from where I was staying. While conversing with one driver in my rudimentary Spanish, I found out that his family was spending $3,000 a month for a two…

  • Villanova vs. Michigan in Athletic Costs

    Villanova clearly dominated Michigan on the basketball court and has now won the NCAA Men’s basketball tournament two of the last three years. But how has that success translated to other sports and to the athletic costs in general.    The Equity in Athletics data is released annually by the…

  • CDC Publishes 2016 Natality (Births) Data

    The CDC recently released updated Natality (Births) data for 2016. State laws require birth certificates to be completed for all births, and Federal law mandates national collection and publication of births and other vital statistics data. The National Vital Statistics System provides access to statistical information from birth certificates and CDC makes…