Private Room Average Hospital Stays up 10%

While average length of stay has experienced a long-term decline, one component of average stay seems to be increasing – private rooms. The average stay in a private room increased nearly 10% based on an analysis of the 2016 Medicare Provider Analysis and Review (MedPAR) data set. 


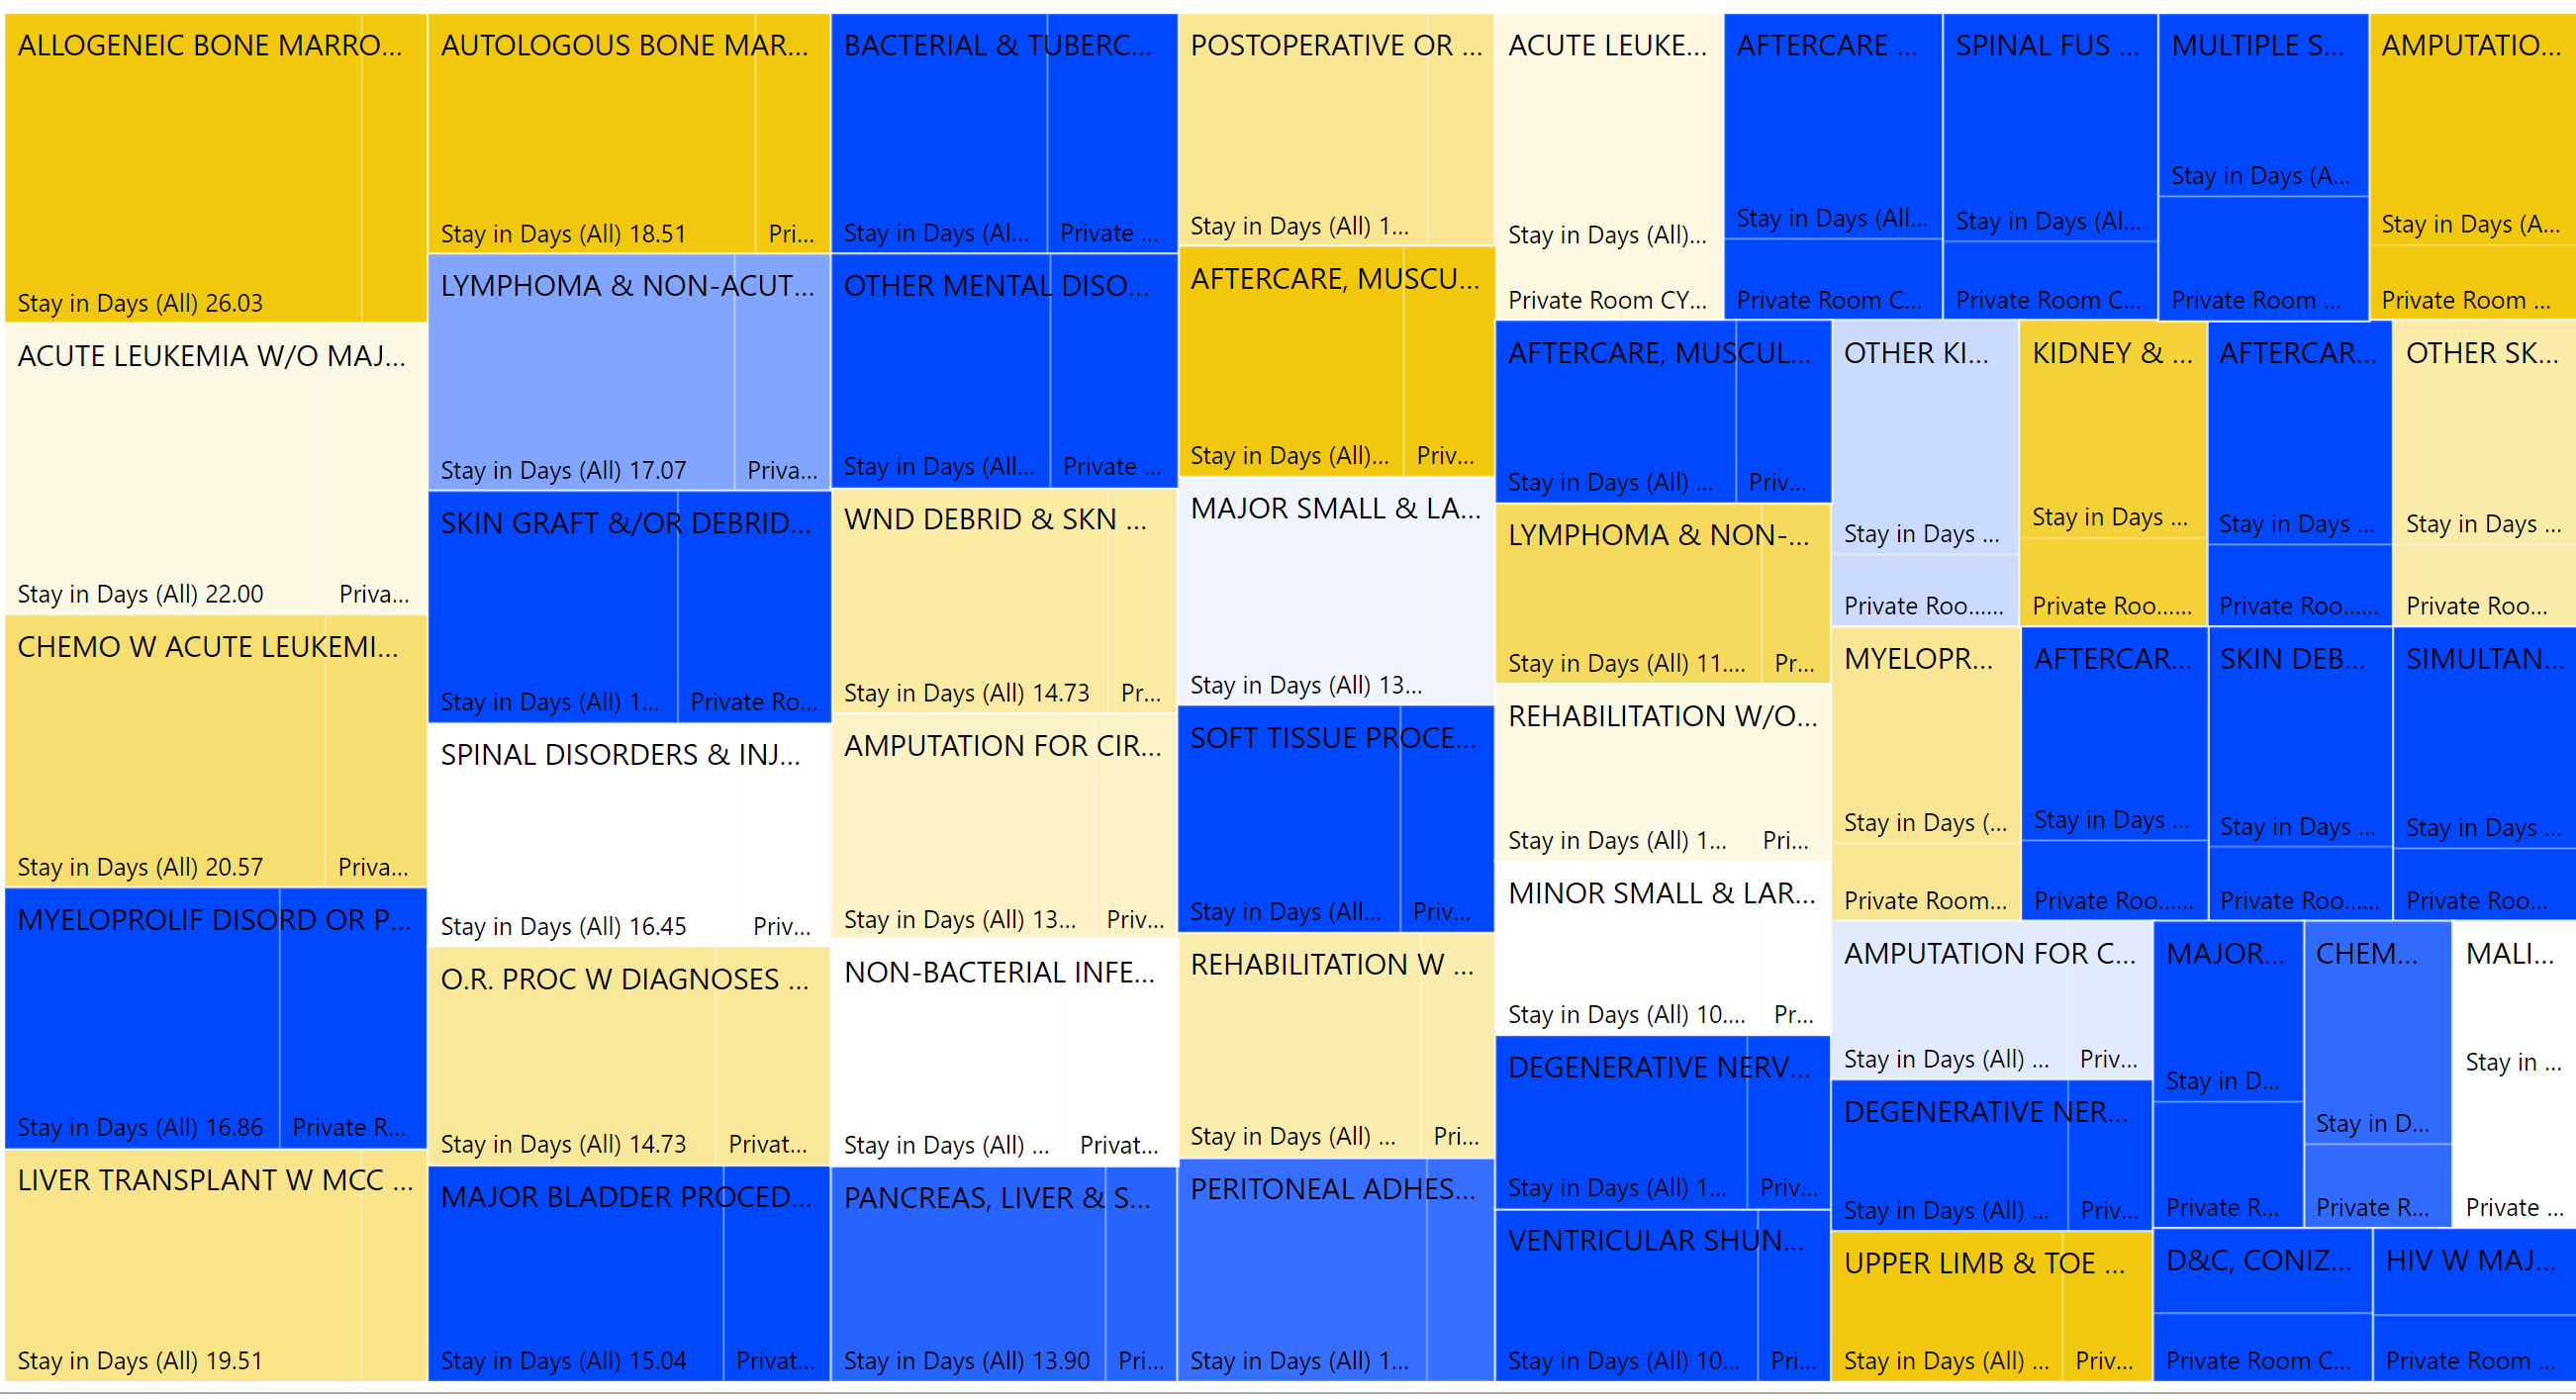
Even more interesting is that, of the top 50 procedures ranked in terms of overall average stay, 23 or nearly half have experienced a 20% rise or greater in the average stay in a private room. This is shown by the dark blue color in the tree map below. The darker gold color shows decline in average private room stay with lighter colors showing minimal change.


MedPAR is based only on Medicare beneficiaries so the private room data may be explained by the decrease in infection rates from private room stays. Private rooms may not be viewed anymore as a luxury, but as a necessity. A hospital may be trading one set of costs for another.


Share This Story

Similar Posts

  • The States That Send Students Elsewhere

    IPEDS reports residency numbers for first-time undergraduates by state. This data can be challenging to work with from several perspectives. It is not collected every year by every institution and it does not summarize the students coming from out of the state of the institution.     The Enrollment Suite…

  • What the Ascension – Presence Merger Reveals

    This week, Ascension Health acquired Presence Health, combining the largest Catholic-sponsored healthcare system in Illinois with the nation’s largest Catholic health system, the companies announced Tuesday. The acquisition is subject to regulatory approvals. The deal underscores a continued trend towards market consolidation.    It seems Ascension, at 141 hospitals, acquiring an…

  • STEM Enrollment Fields Show Strong Growth

    The IPEDS Enrollment by Major Fields of Study is collected every other year and 2016 is a new reported year. IPEDS collects nine major fields of study and the enrollment is disaggregated by attendance status (full-time, part-time), level (undergraduate, graduate), race, and gender.   There are numerous ways to breakdown…

  • Using AI to Break Down Head Count

    New Microsoft® Power BI Visual Dynamically Analyzes Categorical Data Like fashion goes in and out of style, so do visual ways of exploring data. Several decades ago I worked with a visual called the Decomposition Tree from an upstart company Proclarity from Boise, Idaho to analyze multi-dimensional data. That company…