FAFSA Application Volume Down 11%

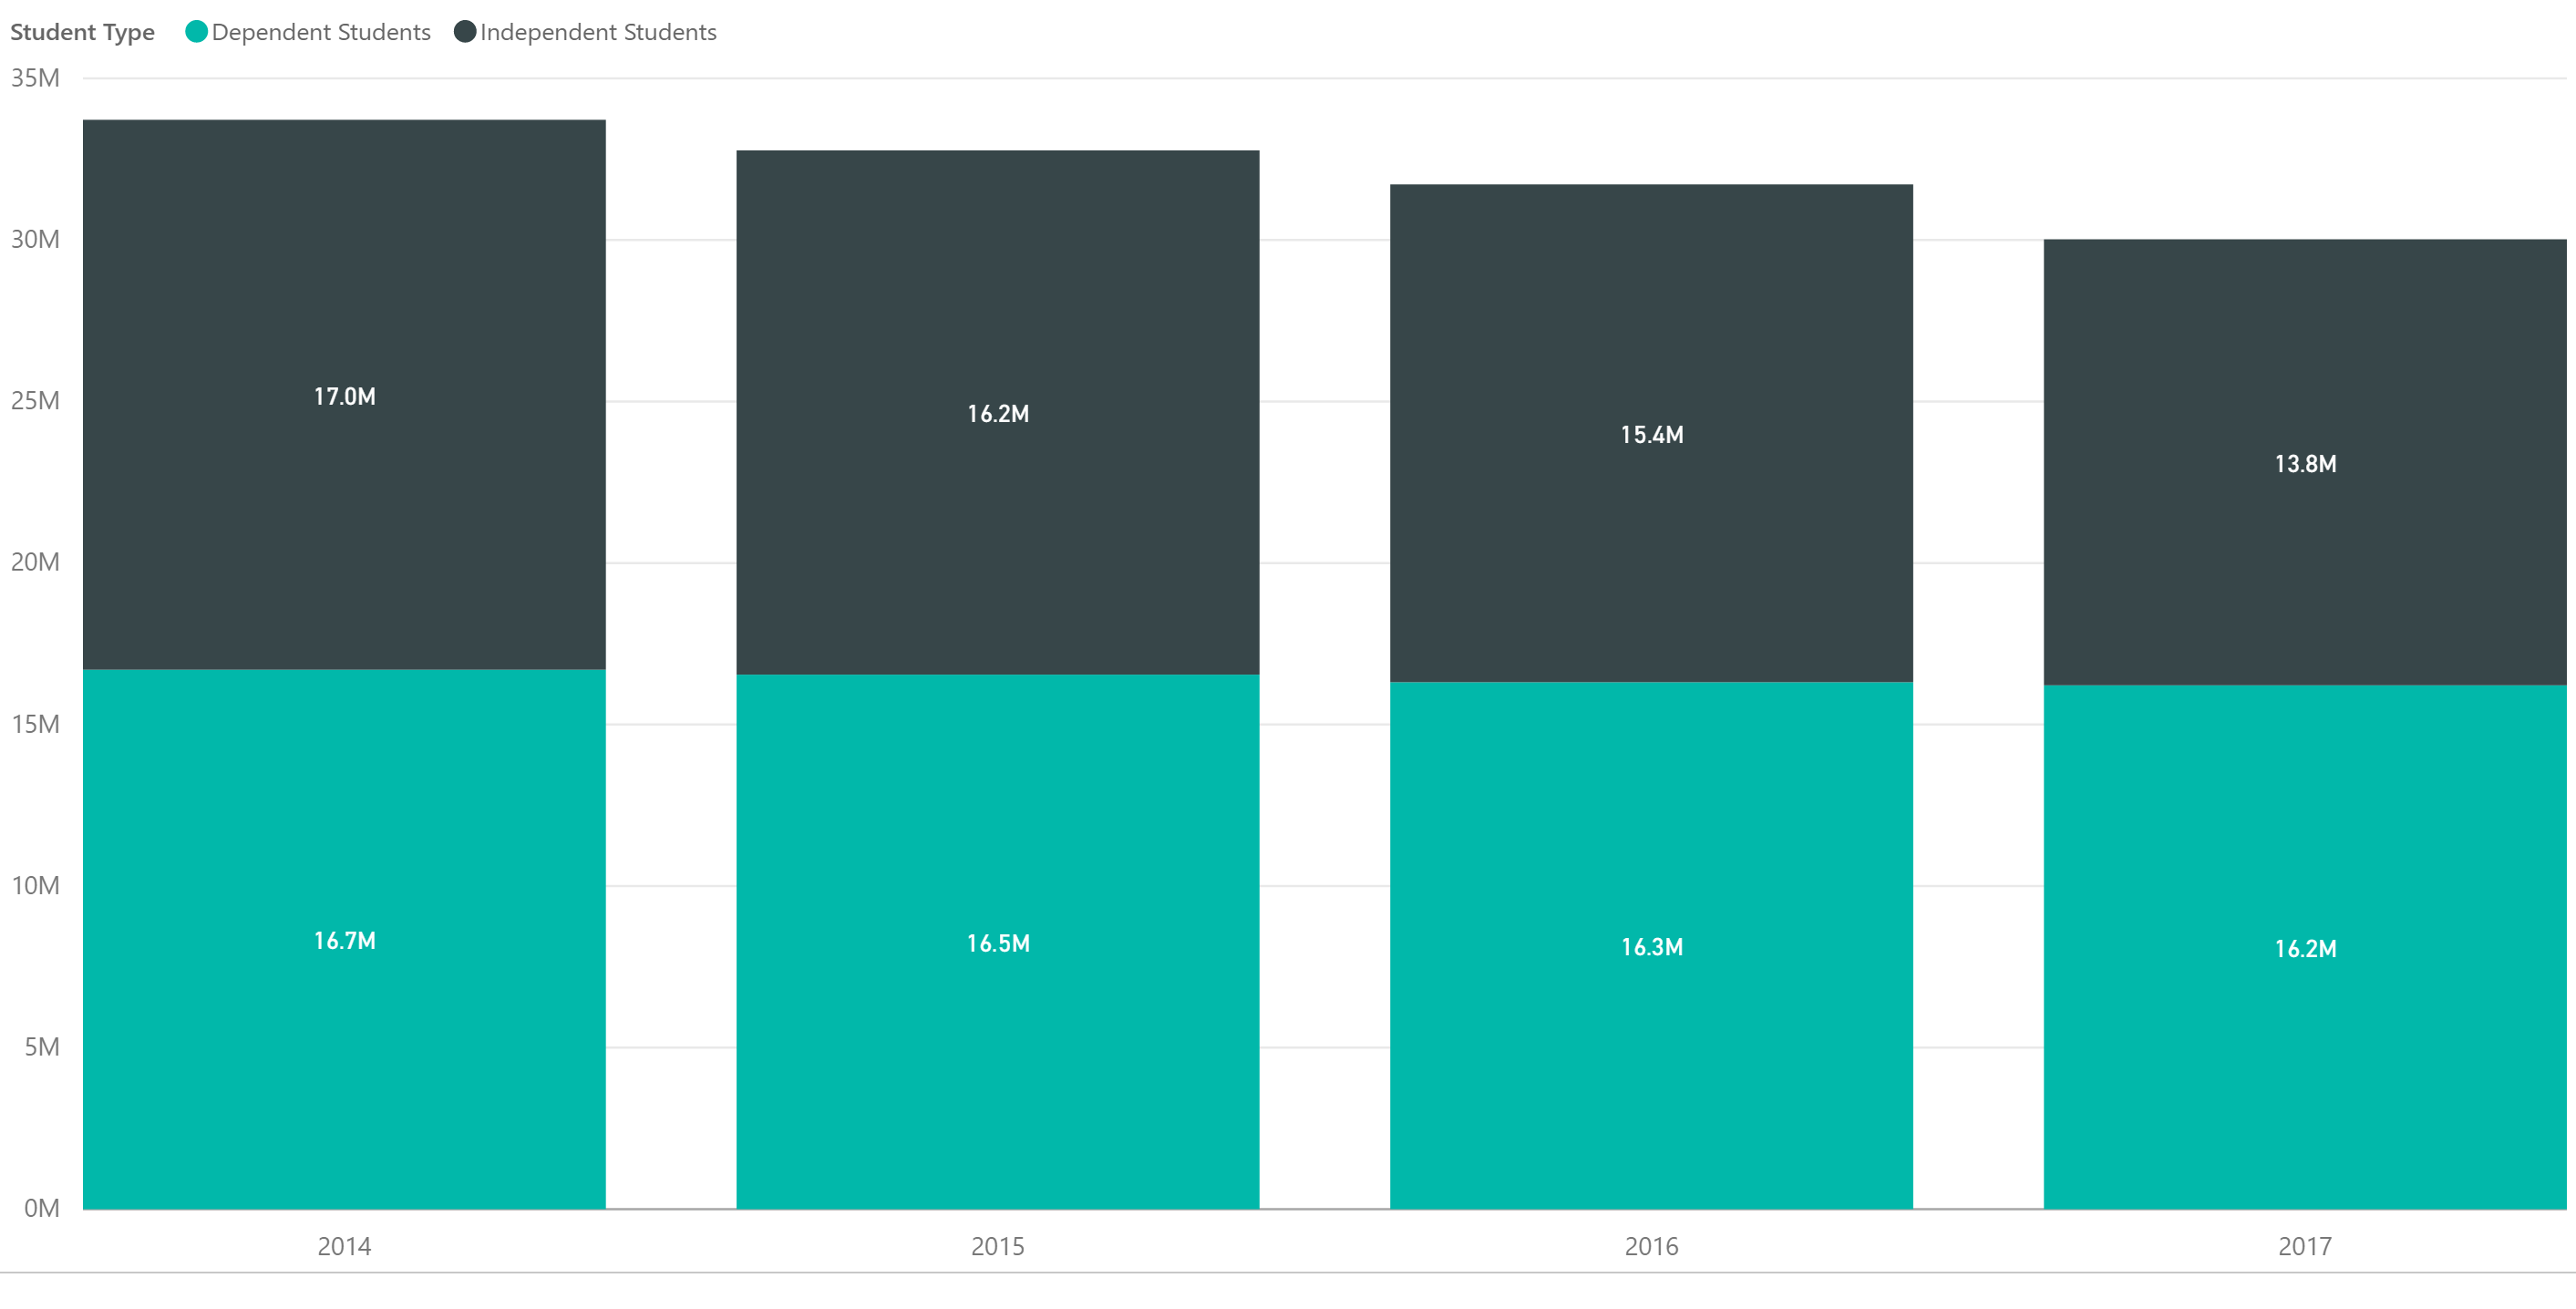
The FAFSA Application Volume declined nearly 11% for the application cycles from June 30, 2014 through June 30, 2017 based on data from Federal Student Aid and analyzed using the Financial Aid Interactive. FAFSA application cycles are based on an 18-month period for any one particular school year.  Note the June 30, 2017 cycle has one quarter to go but the last quarter is historically less than 1% of the total volume. 


The volume change was almost exclusively concentrated with independent students which declined nearly 19% during the same period. Dependent students remain relatively flat during the same period as noted in the following graph. 


Share This Story

Similar Posts

  • 12 College Programs with 100+% Growth

    Johnny Nash wrote an award winning song in 1972 called “I Can See Clearly Now”. It was one of those one-hit wonders that still is around today. Johnny would be proud to learn that the field of Vision Science and Physiological Optics topped our findings for emerging program growth with…

  • Death Rates Rise Sharply for Millenials

    The new CDC mortality data continues to paint a rather grim picture. Last week we focused on the external causes of the rise in death rates. This week we analyzed the mortality (death) rate among age groups using over 1.8 billion data points over 17 years from the CDC. You…

  • Distance Education Rebounds

    Distance Education is now 12.3% of all programs and up 7.6% in 2018 Social distancing, at least for now, is the new normal and along with it comes distance education. Each year we look at what the data is telling us for distance education programs. Last year, I suggested that…

  • When is a Job Essential?

    Critical Infrastructure Accounts for 60% of Jobs as the Rest Open Up The stay-at-home orders under the COVID-19 pandemic separated “essential” from “non-essential”. Businesses deemed essential stayed open. Those that were not essential shut down. Sometimes those lines were very blurred with individual states and even communities making those choices…

  • Diving Deeper into Opioid Prescriber Data

    Last week we introduced the new CMS opioid data set and what it means. This data tries to initiate transparency around this hot topical area even though Part D Medicare claims may not be the best proxy of all opioid prescription activity. There are three elements to this data: Part…

  • Regional Variations in Opioid Prescribing Rates

    Given the state of the opioid crisis, any meaningful data is valuable. So when CMS released three years of Opioid Part D prescription data in November, we all rejoiced. CMS also released a mapping tool to analyze the data. While mapping tools can be effective, they can also get in…