Is Education Required for Fast Growing Jobs?

A hot topic, especially when new job projections come out, is whether the high growth jobs require much in the way of education. Jed Kolko at Indeed Hiring Labs did a very thorough job of analyzing projected occupational growth against their respective education requirements. His conclusion was that the slower or negative growth jobs require minimal education but the growth areas require further education. The article focuses on the typical education required, but the Bureau of Labor Statistics also provides educational attainment percentages for each occupation. We can blend the educational attainment rates against the projected growth rates and the median wage.


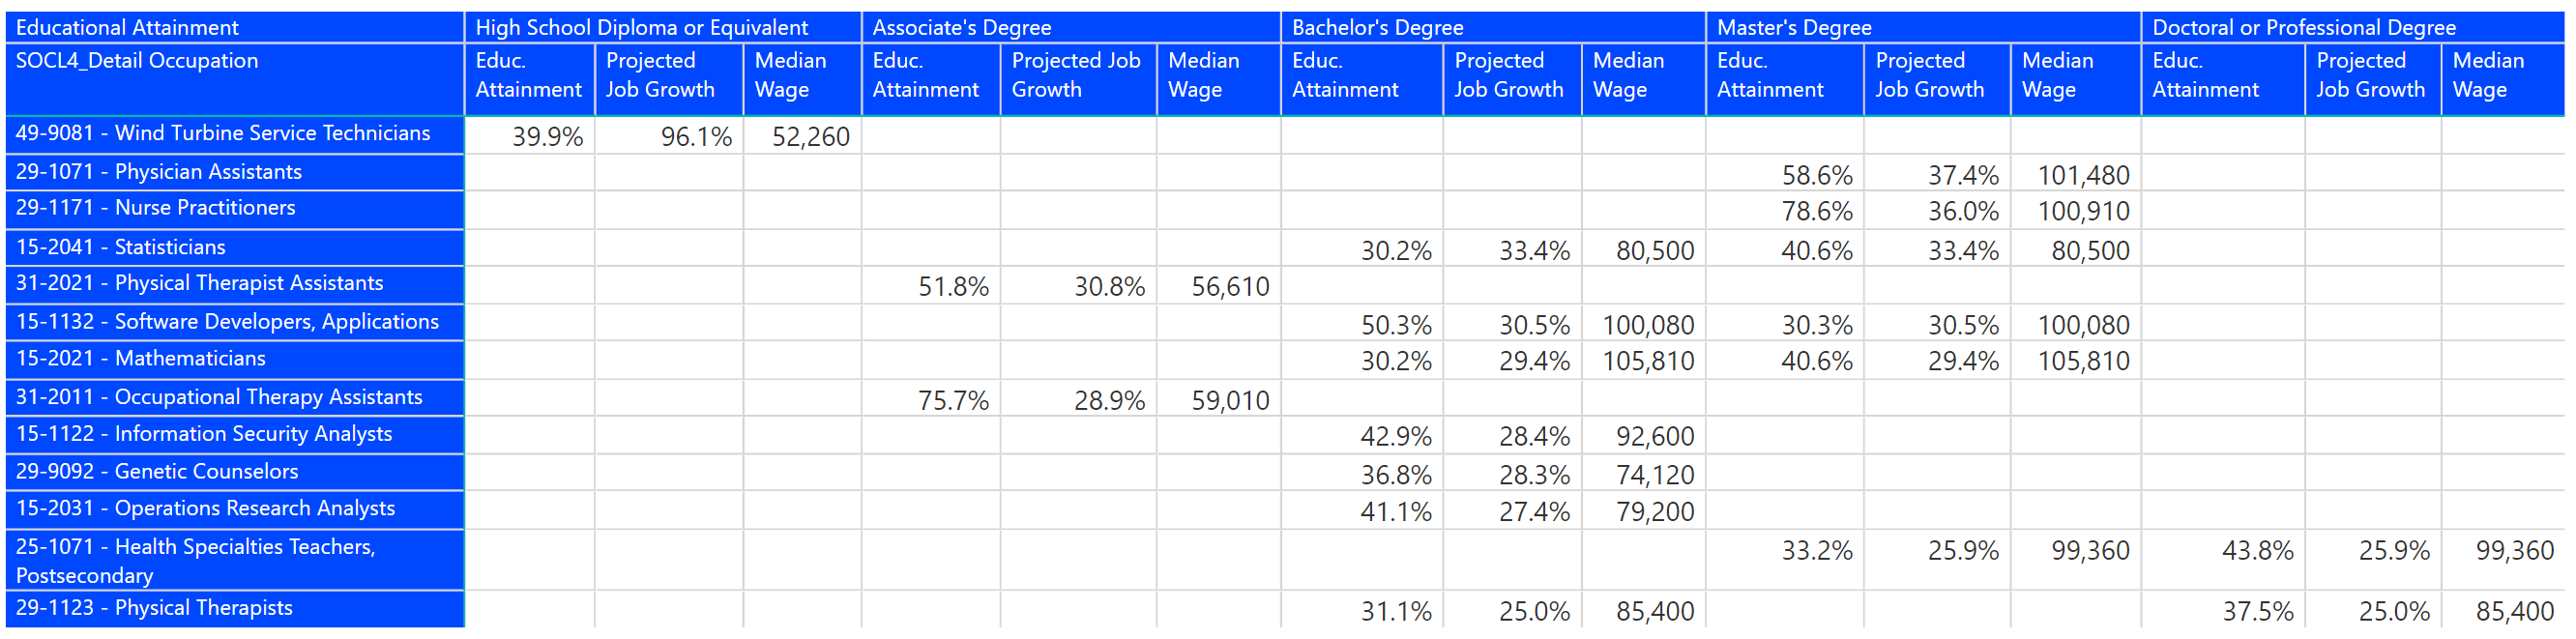
I modified the Degree-to-Jobs Interactive to organize the occupations into educational attainment buckets and looked at job growth and median wage. For example, I filtered for only those occupations that are expected to grow 20% without regard to median wage. This brought 12 occupations that only require a high school education. If I increase the minimum median wage to $40,000, I still get five occupations requiring no college education.  However, if I increase the job growth rate to 25% and the minimum median wage to $50,000, 11 out of 12 occupations require a college education as shown below. This threshold seems to knock out high school only education levels.


We have created a new Free Interactive called Job Projections and Education on our site.  You can fine-tune the filtered selections to select the parameters of the table. You can also sort and export the table. To access Free Interactives, you simply have to register.  Free Interactives will show up at the bottom of the Interactives page as shown below. Simply click the view link to launch the Interactive.


 

Share This Story

Similar Posts

  • What is the Newly Released Carnegie Data?

    The Carnegie Classification™ has been the major institutional framework for describing higher education institutions since 1970. This classification system comes out approximately every five years with the latest rendition released on February 1, 2016. This release represents the initial data provided by the Indiana University Bloomington Center for Postsecondary Research…

  • What do Sierra Vista and Hinesville Have in Common?

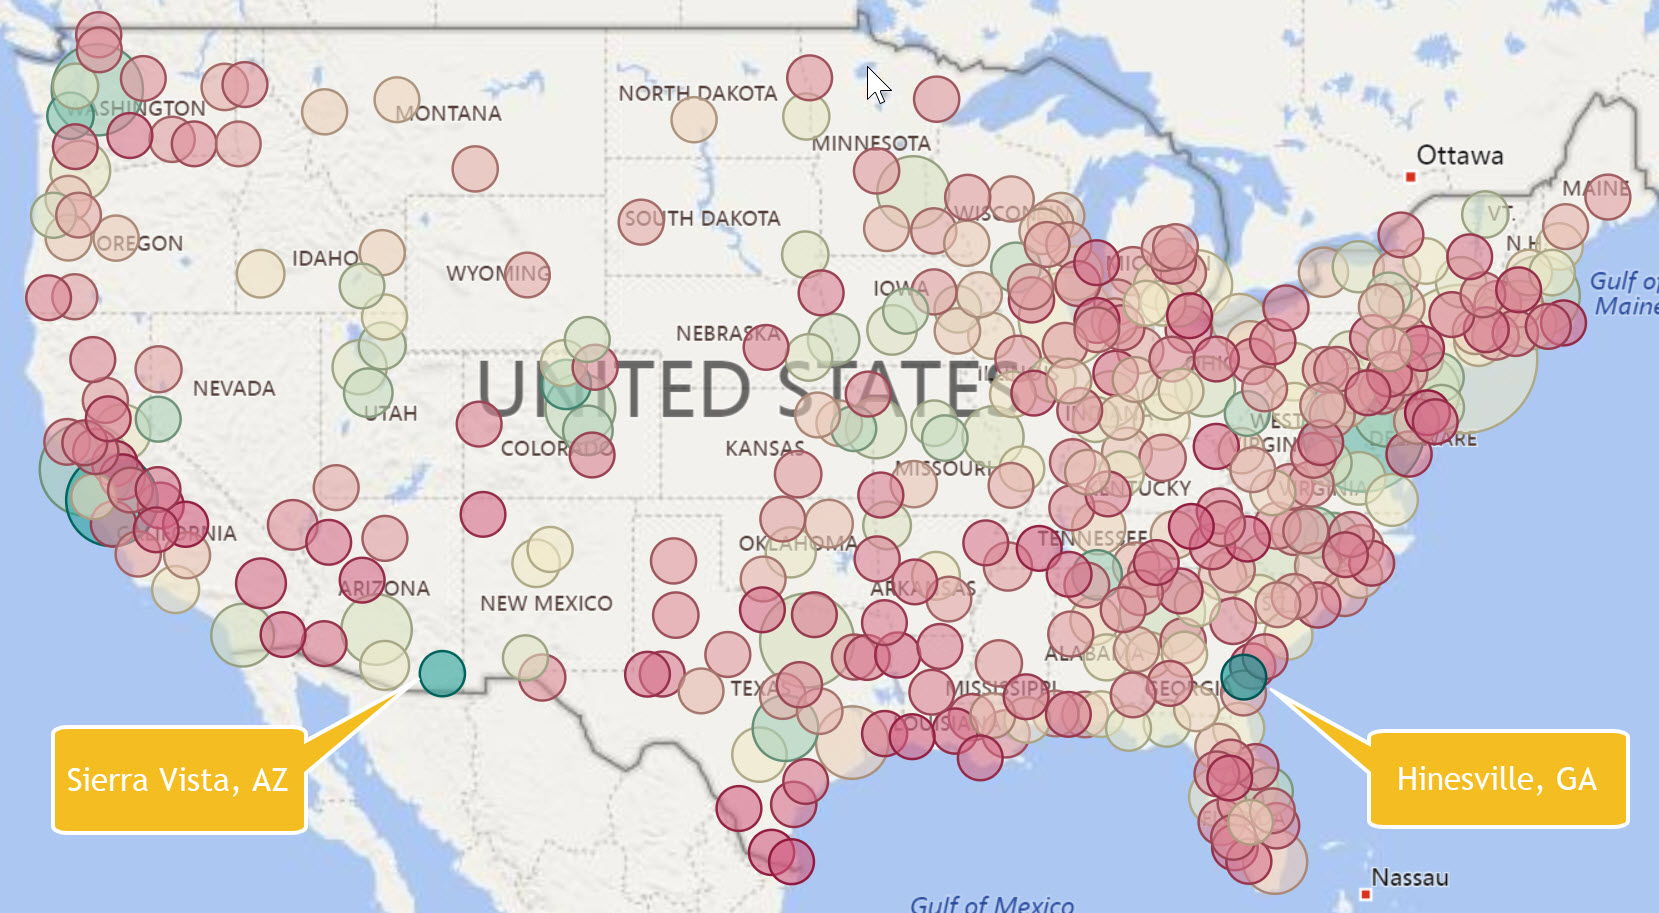
    Sierra Vista, AZ and Hinesville, GA probably don’t seem to have much in common. One is in eastern Arizona and the other is in southeast Georgia. They are both very small cities with populations of around 40,000. What they have in common is a market concentration for computer occupations with…

  • EVICTED – The Impact of Housing Affordability

    I was in the Bay Area this week for a health technology conference at Stanford University. I took Lyft back and forth from where I was staying. While conversing with one driver in my rudimentary Spanish, I found out that his family was spending $3,000 a month for a two…

  • Healthcare Rankings and the Healthiest Cities

    We in the U.S. love our rankings. I think it is embedded in our DNA. As a student of data, I love to see the various rankings and how people get worked up over them. Healthgrades recently released its latest analysis of top quality hospitals and its National Health Index, which…

  • Hot Educational Programs in 2018

    Econometrics Programs Show Nearly Triple Digit Growth I am delighted to return to the blogosphere community. It has been a few months since we have published a blog, but not for a lack of work going on behind the scenes here at Public Insight. You will notice that our blog…

  • Regional Variations in Opioid Prescribing Rates

    Given the state of the opioid crisis, any meaningful data is valuable. So when CMS released three years of Opioid Part D prescription data in November, we all rejoiced. CMS also released a mapping tool to analyze the data. While mapping tools can be effective, they can also get in…