Nursing Home Coverage of the Elderly

While long-term care services more than the elderly, approximately 63% of residents are 65 or older. According to the Administration on Aging, population 65 years or older will increase from 14.1% of the population to 21.7% of the population by 2040. As the population ages over the course of the next 24 years, additional long-term facilities will need to meet the demand. Yet residents in nursing homes have been flat for the past year. Further, coverage of the 65 and over age demographic ranges widely across the country.


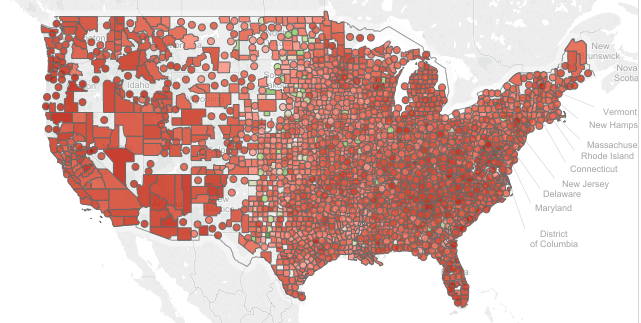
We constructed a ratio of residents in nursing homes to county populations 65 and over from the American Community Survey. Results range from .2% to 18.7% of the population. Geographic concentrations of high coverage are in the Midwest with low coverage in the west coast and Florida. The Tableau visualization shows visually the concentration. Counties highlighted in green have high coverage while those in red show lower coverage. You can use the slider to reveal counties within a range of coverage values. To interact with the Tableau visualization and the data, click HERE.


Share This Story

Similar Posts

  • Powerball and Endowment Wealth per Student

    Large dollars tend to attract many of us. That is why the Powerball attracted so many people at the tidy sum of 1.3 billion. Yet the larger the number, the more people participate. Someone had the brilliant idea of distributing Powerball winnings to everyone in the country thinking it would…

  • International Student Enrollment Visualized

    In last week’s blog, we talked about out of state enrollment and its potential impact on both the diversity and finances of the university. International enrollment is even considered a bigger potential bonanza to colleges and universities as many international students pay full tuition. According to the Institute of International…

  • Students Moving Back on Campus

    The number of students living on-campus for the approximately 4,500 non-state institutions has increased from just over 43% in 2011 to nearly 53% just four years later in 2015. The pie graph below shows the movement from 2011 to 2015 with the yellow slice indicating the percentage of students living…

  • Are Outpatient Imaging Quality Measures Effective?

    CMS began developing measures evaluating imaging efficiency back in 2007. These performance measures have been distributed as part of Hospital Compare for the past four years. Lower percentages suggest more efficient use of medical imaging. The purpose of reporting these measures is to reduce unnecessary exposure to contrast materials and/or…

  • CDC Publishes 2016 Natality (Births) Data

    The CDC recently released updated Natality (Births) data for 2016. State laws require birth certificates to be completed for all births, and Federal law mandates national collection and publication of births and other vital statistics data. The National Vital Statistics System provides access to statistical information from birth certificates and CDC makes…

  • Room and Board Cost Increases Slowing

    After three straight years of 3-5% increases, room and board annual growth has finally slowed to a more pedestrian 2-3%. In recent years, universities have invested heavily in on-campus facilities and presumably passed these costs to the students at a rate greater than inflation. One administrator once told me that on-campus facilities…