Free-Lance Economy Continues Upward Climb

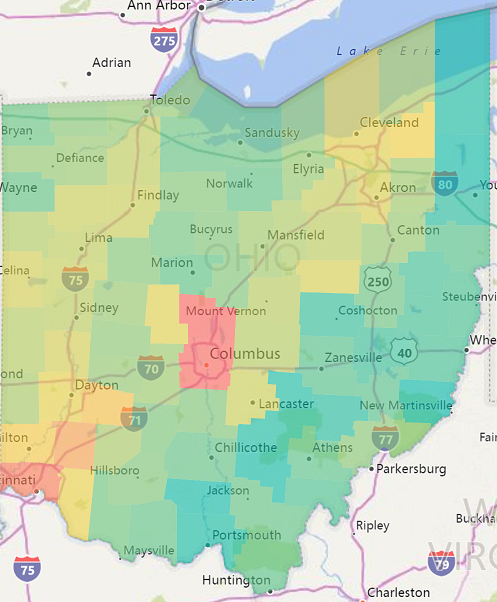
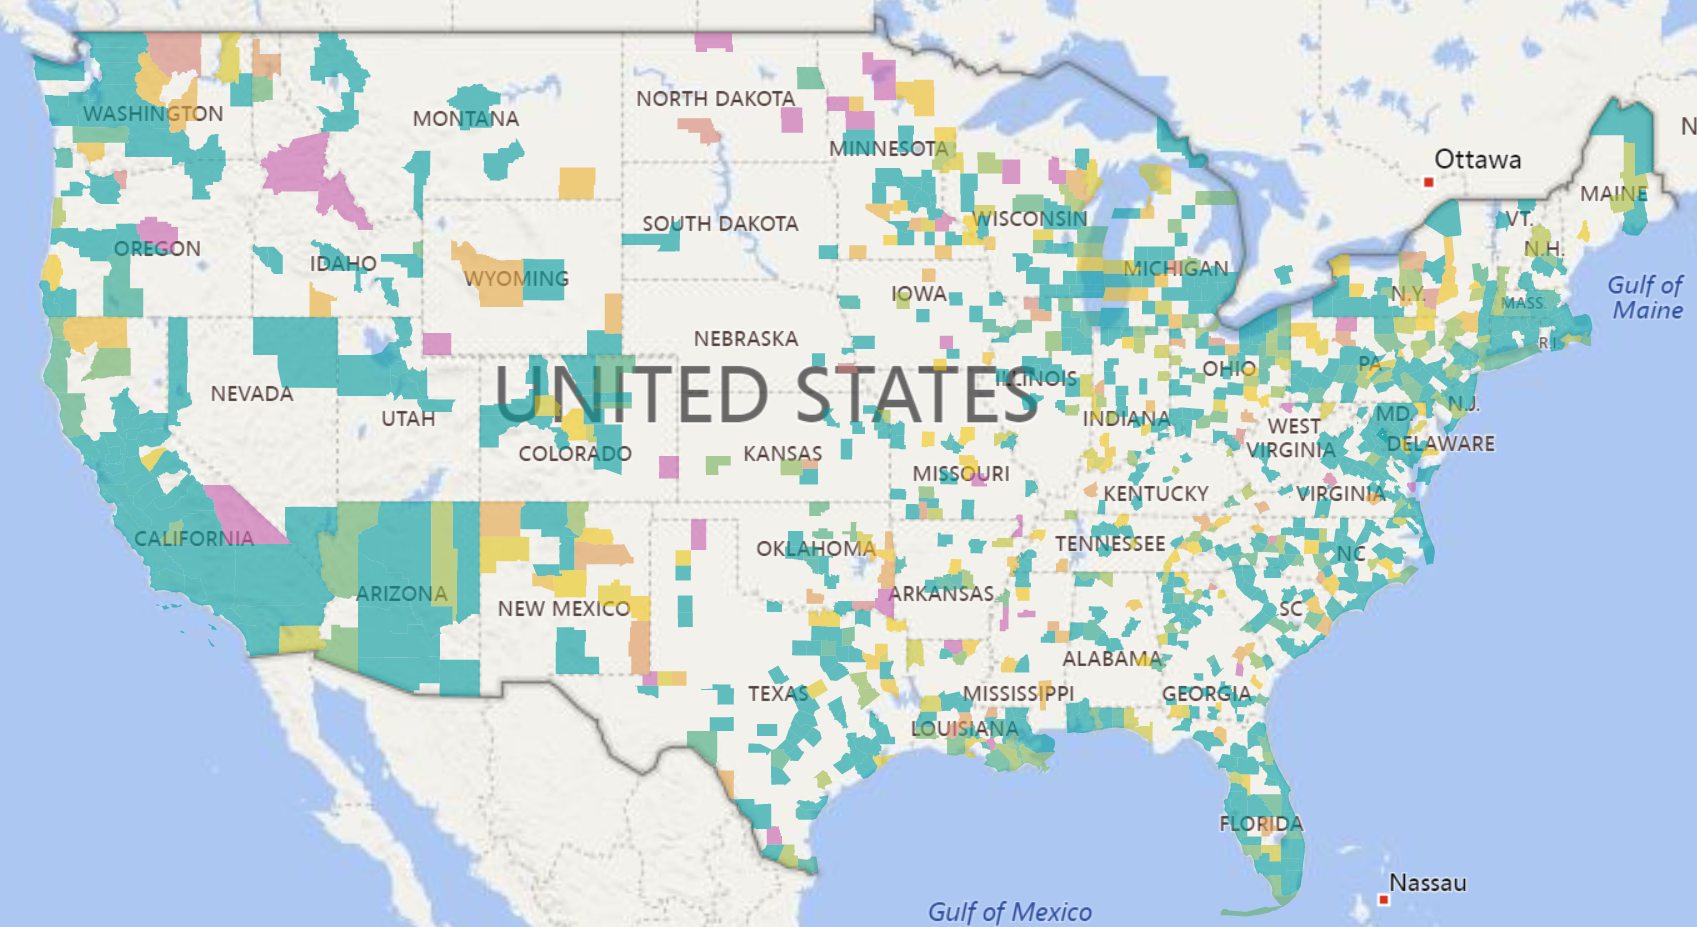
Moonlighting used to be a term that described a minority of people. If you moonlighted, you were supplementing your income. You either did it for extra cash or because you had to just to pay the bills. The freelance economy and the growth of the personal transportation industry alone have made many of us moonlighters and freelancers according to the latest Nonemployer Statistics released last month by U.S. Census.Gross receipts for transportation industries with NAICS codes of 4853 and 4859 have increased over 86% over the past four years. In spite of the economic boom we are in and low unemployment, these industries continued to show over 20% growth in gross business receipts from 2015 to 2016. The counties shown below in blue have receipts growth over four years of above 50% in these industries.


The Census defines a nonemployer business as one that has no paid employees, has annual business receipts of $1,000 or more ($1 or more in the construction industries), and is subject to federal income taxes. Most nonemployers are self-employed individuals operating very small unincorporated businesses, which may or may not be the owner’s principal source of income. Nonemployer statistics originate from Internal Revenue Service tax return information. This data is the companion to the County Business Patterns which covers employer businesses. In addition to the boom in the transportation industries, there has been steady upward growth in healthcare support and educational services. Interestingly, construction freelancing has leveled off with meaningful growth in employer payroll.

Share This Story

Similar Posts

  • Tuition Bears Increasing Brunt of Higher Ed. Revenue

    In 2011, Tuition and Fees represented 20.6% of public institutional revenue. In 2015, it has increased to 24.25%. Most of the reshuffling of revenue has come from federal operating grants and contracts as noted by the graphs below. Interestingly, state appropriations have remained relatively constant. Similarly, non-profit institutions have seen tuition…

  • Inpatient vs. Outpatient – What the Numbers Show

    Analysts in health care don’t agree in unanimity very often, but most seem to agree that there will continue to be a quantum shift in healthcare from inpatient to outpatient. In this two part series, we will attempt to quantify and support this important trend. We utilized the Beds and…

  • Student Debt Continues to Rise – Repayments Flat

    Last week, the Government Accountability Offices announced that the federal government will forgive a whopping $108 billion in student loans in the coming years. Prognosticators project a coming economic doom as the student debt crisis approaches mortgage meltdown proportions.   Last week we focused on the earnings of students six…

  • Is Bureau of Labor Statistics Data Adequate?

    Several weeks ago, the Bureau of Labor Statistics (BLS) released updated Occupational Employment Statistics (OES) survey data. BLS OES is one of those foundational programs and datasets that are used for comprehensive occupational analysis. It produces employment and wage compensation estimates annually for nearly 800 occupations. These estimates are available…

  • Student Earnings Experience a Sluggish Recovery

    College students are earning 8% less in 2013 than in 2008 per the most recent data published by the US Department of Education College Scorecard database. Students earned $31,382 in 2013 compared to $34,119 in 2008. The earnings were ostensibly flat from 2012 earnings of $31,528.   The College Scorecard…

  • Room and Board Cost Increases Slowing

    After three straight years of 3-5% increases, room and board annual growth has finally slowed to a more pedestrian 2-3%. In recent years, universities have invested heavily in on-campus facilities and presumably passed these costs to the students at a rate greater than inflation. One administrator once told me that on-campus facilities…