Breaking Down Net Price, Tuition, and Aid

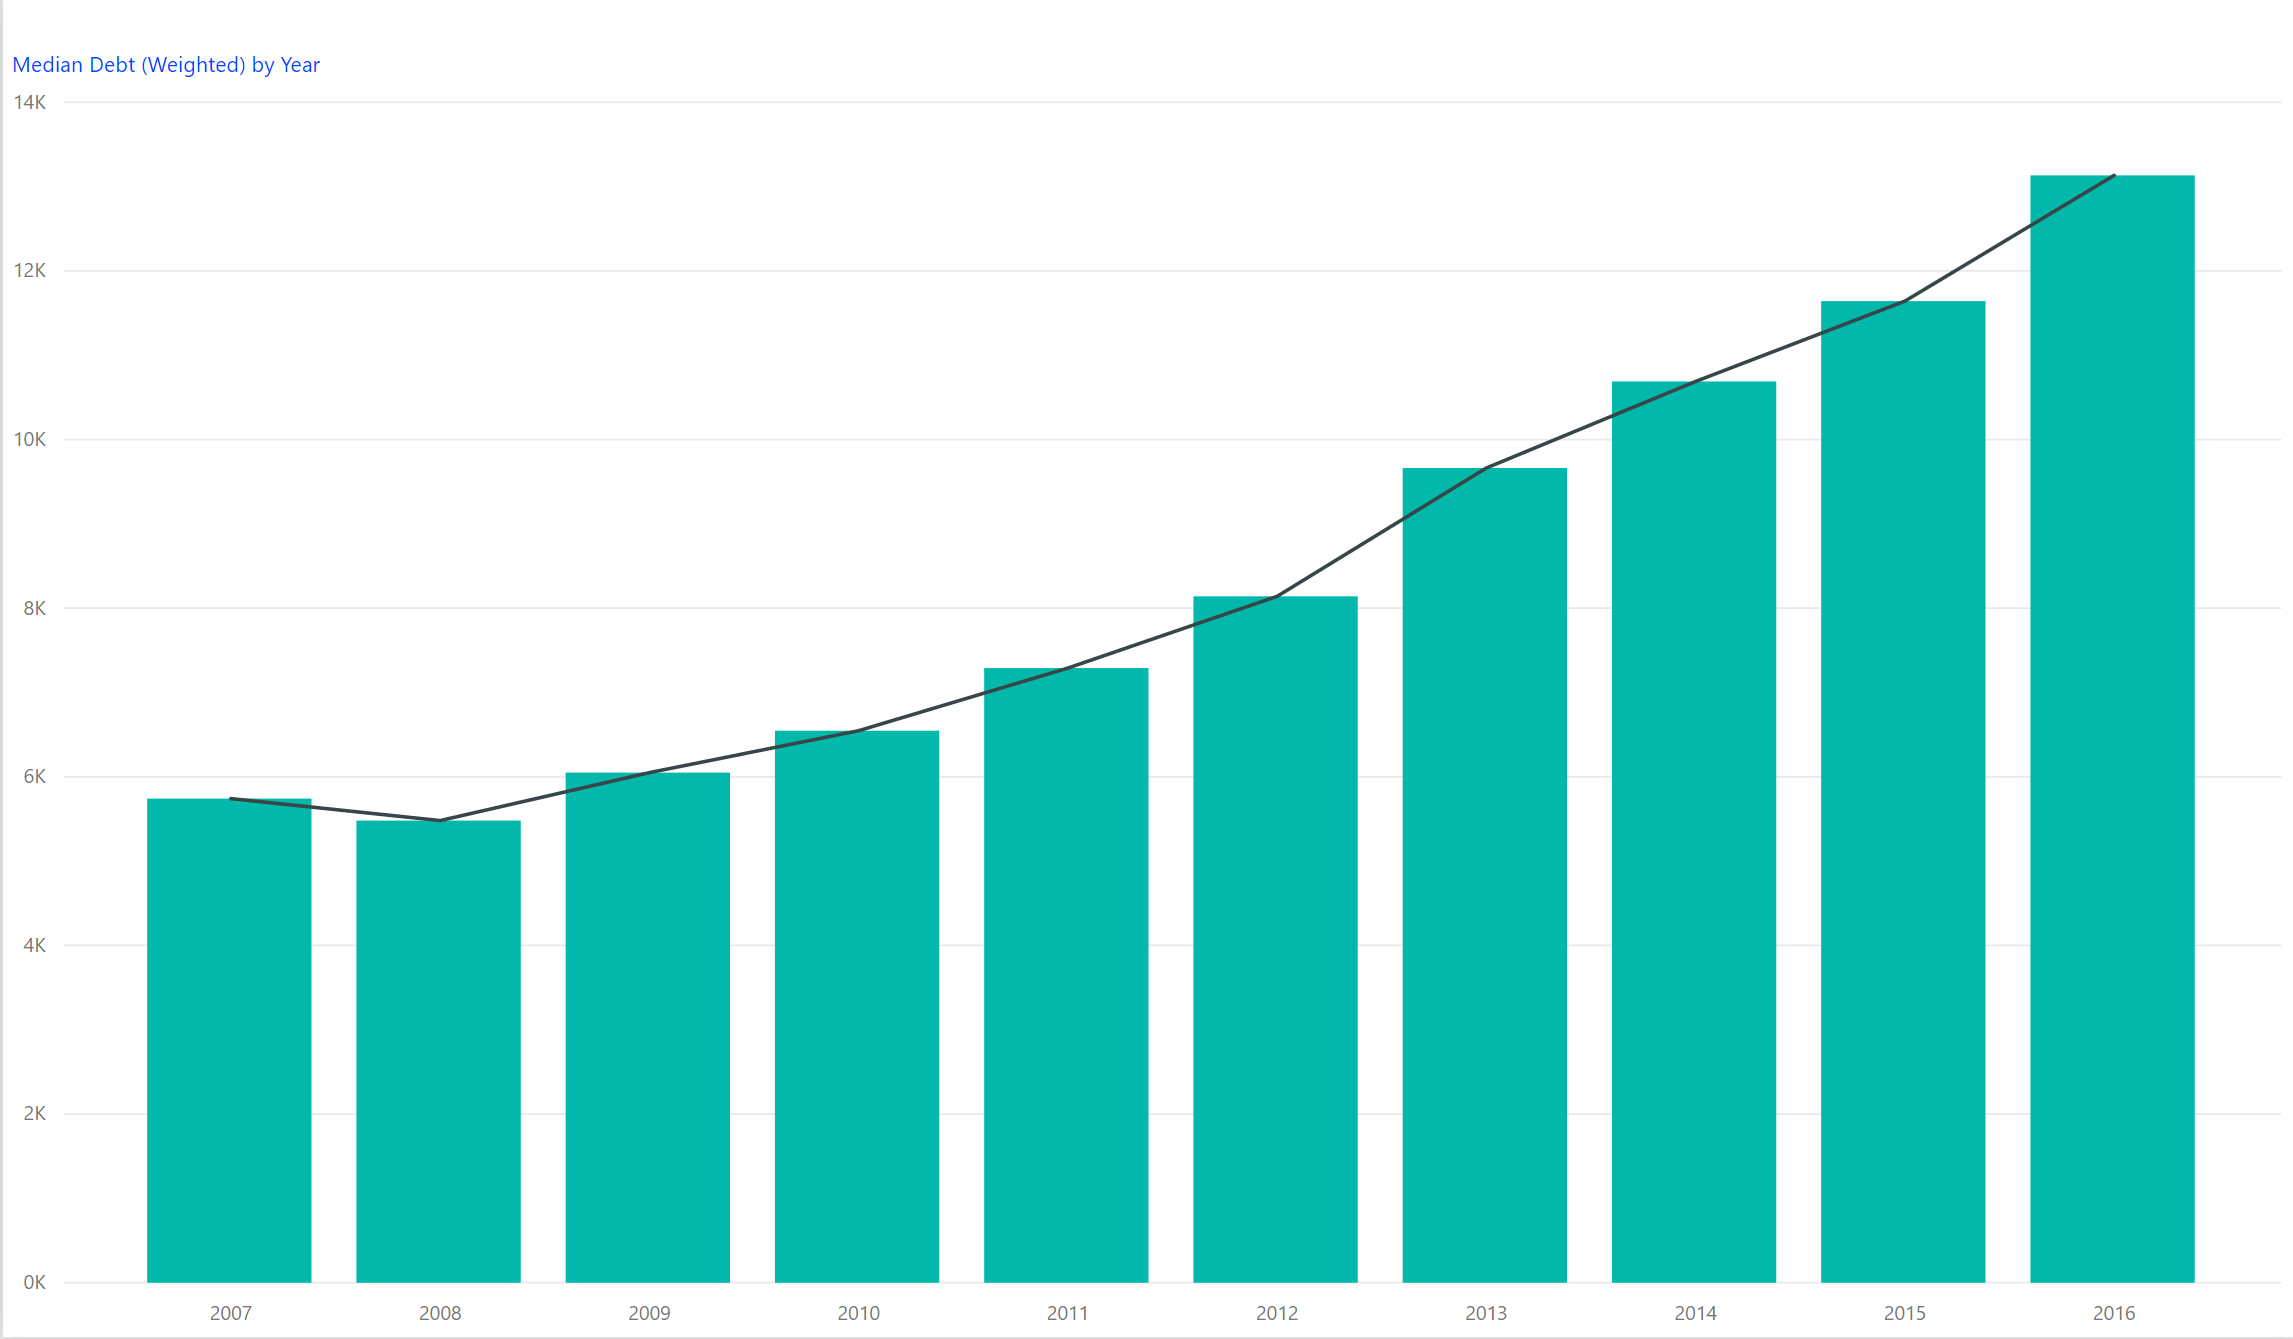
Reports by College Board and others have indicated that net price, the true measure of what a student pays to attend college, continues to rise. College Board has maintained that the actual net price has been increasing for six to eight straight years. 


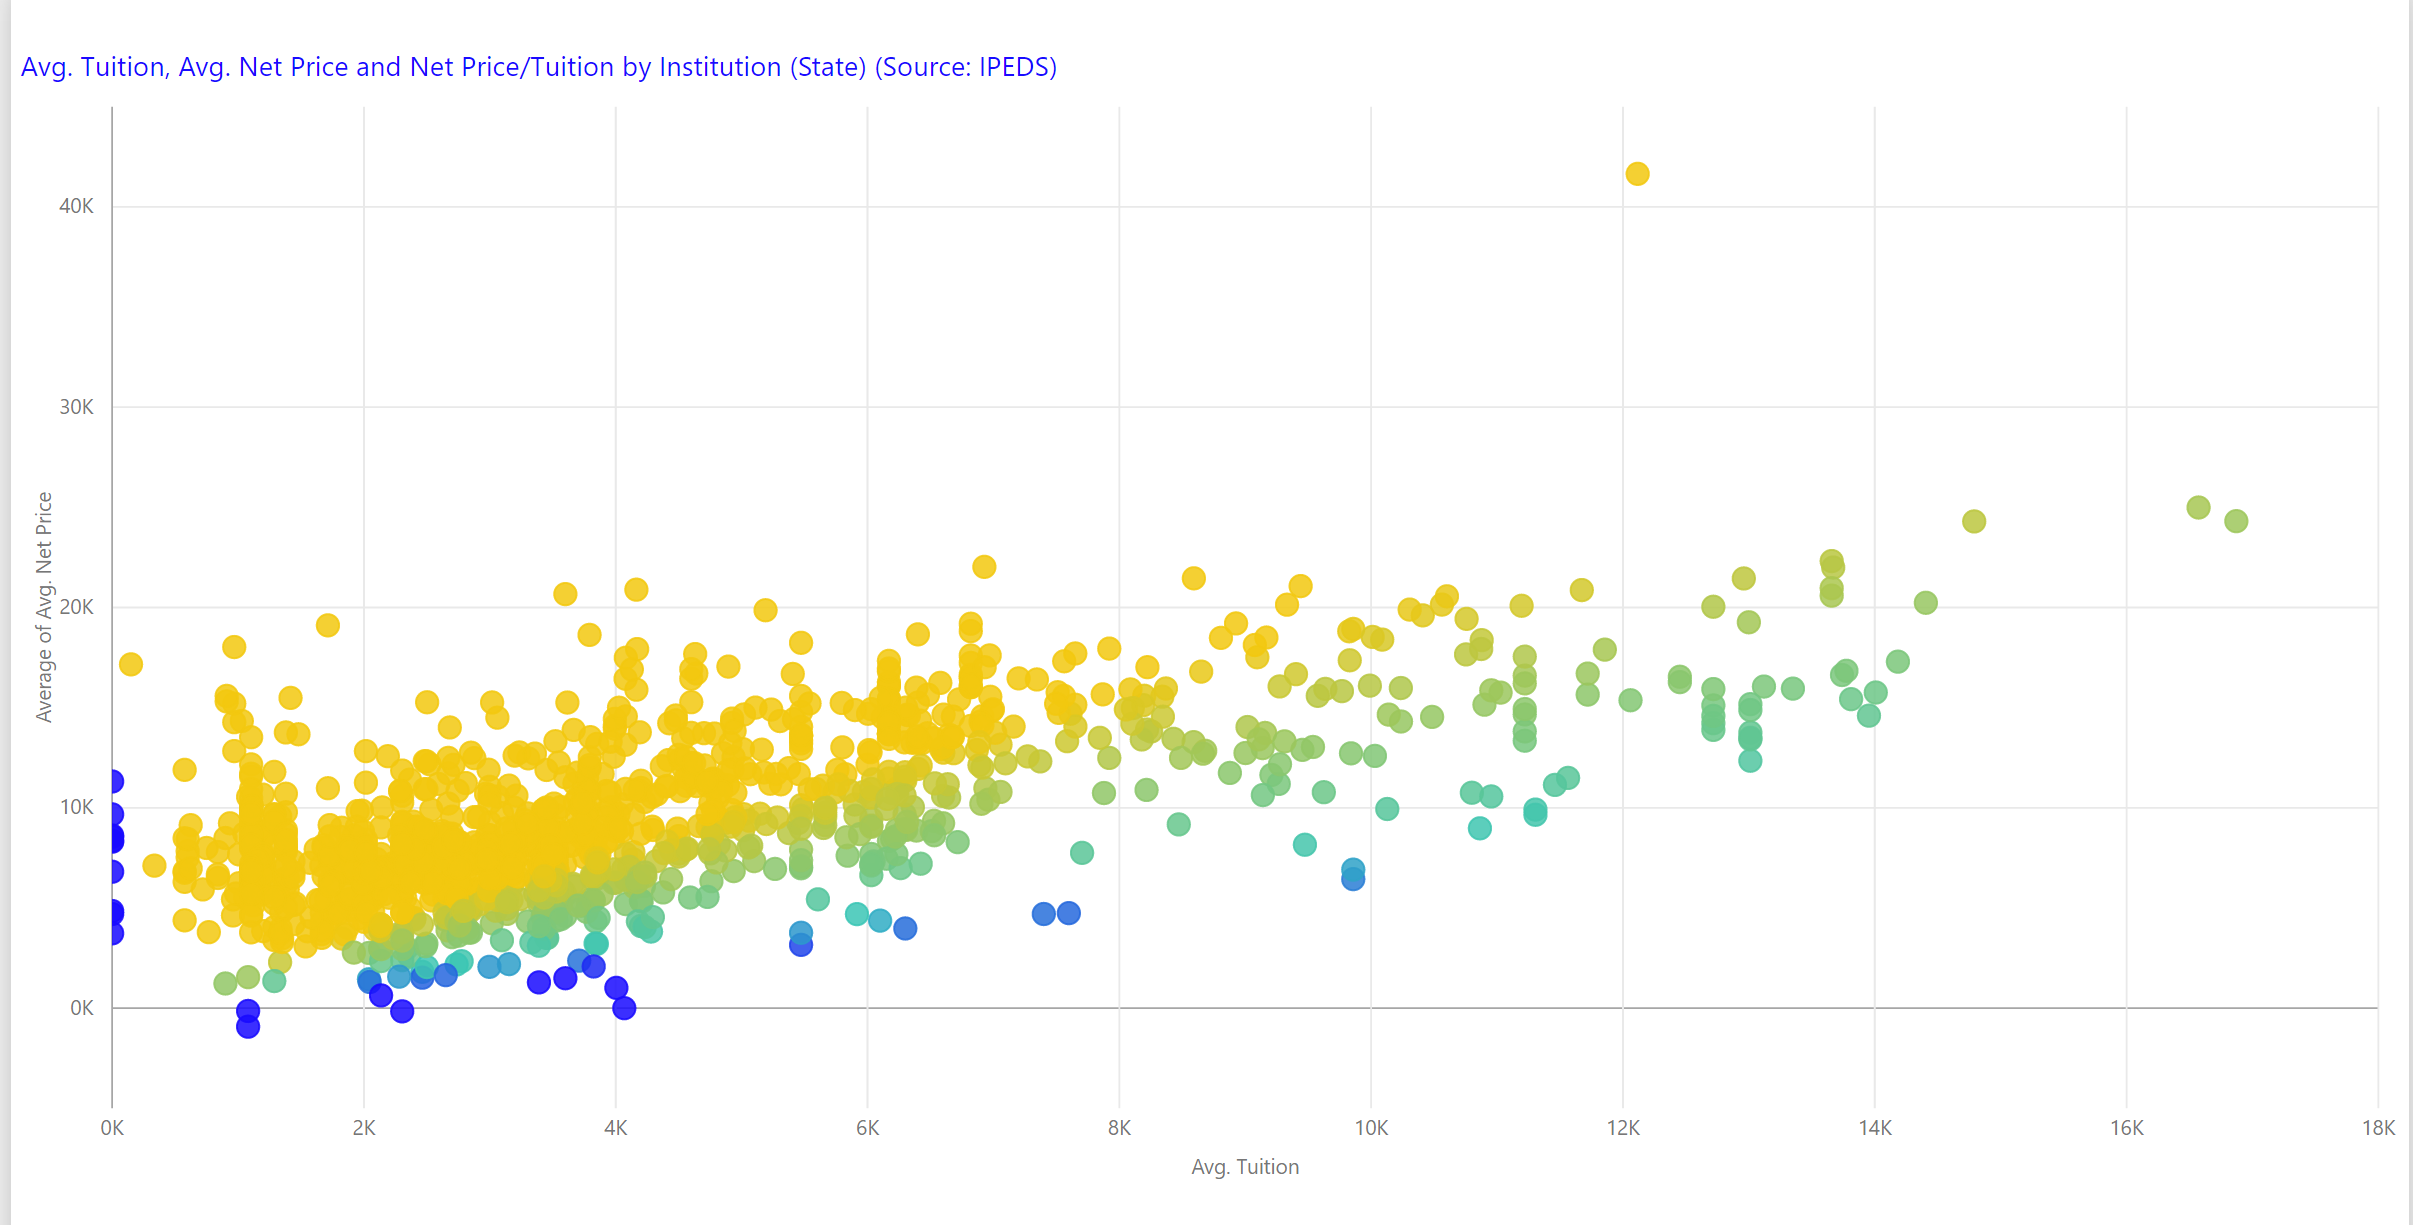
Net price is defined as the costs of attendance (tuition, fees, room and board, supplies) less grants, scholarships, and other subsidized aid. Like a car dealership or a jewelry store, no one pays the published price. Institutions disclose these components separately giving us a bread-crumb of what is going on. Institutions must disclose published tuition, average tuition, expenses, fees, and housing costs. They must also disclose average financial aid and ultimately net price. Today we released an update to our Tuition and Pricing Interactive, which analyzes over 6 million data points from IPEDS over ten years. This updated Interactive is now available to our subscribers. 


The most recent data suggests that the year-over-year changes that are all over the map. For example, why would one institution have a substantial increase in net price while no changes in tuition and other costs and modest declines in financial aid? We dive into this deeper in the video blog.


Share This Story

Similar Posts

  • Is Bureau of Labor Statistics Data Adequate?

    Several weeks ago, the Bureau of Labor Statistics (BLS) released updated Occupational Employment Statistics (OES) survey data. BLS OES is one of those foundational programs and datasets that are used for comprehensive occupational analysis. It produces employment and wage compensation estimates annually for nearly 800 occupations. These estimates are available…

  • College Building Boom Approaches $1 Trillion

    Postsecondary institutions continue to invest heavily in capital assets and the cumulative investment across public and private institutions has crossed $900 billion, an increase of 27% over a five-year period. The capital investment growth rates are almost identical for both public institutions and private non-profit institutions as noted in the…

  • Using AI to Break Down Head Count

    New Microsoft® Power BI Visual Dynamically Analyzes Categorical Data Like fashion goes in and out of style, so do visual ways of exploring data. Several decades ago I worked with a visual called the Decomposition Tree from an upstart company Proclarity from Boise, Idaho to analyze multi-dimensional data. That company…

  • Death Rates Rise Sharply for Millenials

    The new CDC mortality data continues to paint a rather grim picture. Last week we focused on the external causes of the rise in death rates. This week we analyzed the mortality (death) rate among age groups using over 1.8 billion data points over 17 years from the CDC. You…

  • Room and Board Cost Increases Slowing

    After three straight years of 3-5% increases, room and board annual growth has finally slowed to a more pedestrian 2-3%. In recent years, universities have invested heavily in on-campus facilities and presumably passed these costs to the students at a rate greater than inflation. One administrator once told me that on-campus facilities…