Which College is Cheaper – Harvard or Penn State?

Harvard is cheaper, believe it or not at least according to average net prices. What are net prices?  Read more.


Buying a car these days is a breeze. In the old days you had the MSRP on the car which you knew no one paid for and it was up to you to negotiate the best deal. The salesman would always tell you he had to negotiate with his sales manager to get you the deal you wanted. I remember thinking those guys know what the bottom line price is – why don’t they just tell me what the price is? Today, for the most part, you have full transparency when buying a car, except what you pay for the car somehow gets inflated by other costs such as extended warranties, finance charges, taxes, and other fees. Those little buggers can really inflate the cost of a car.


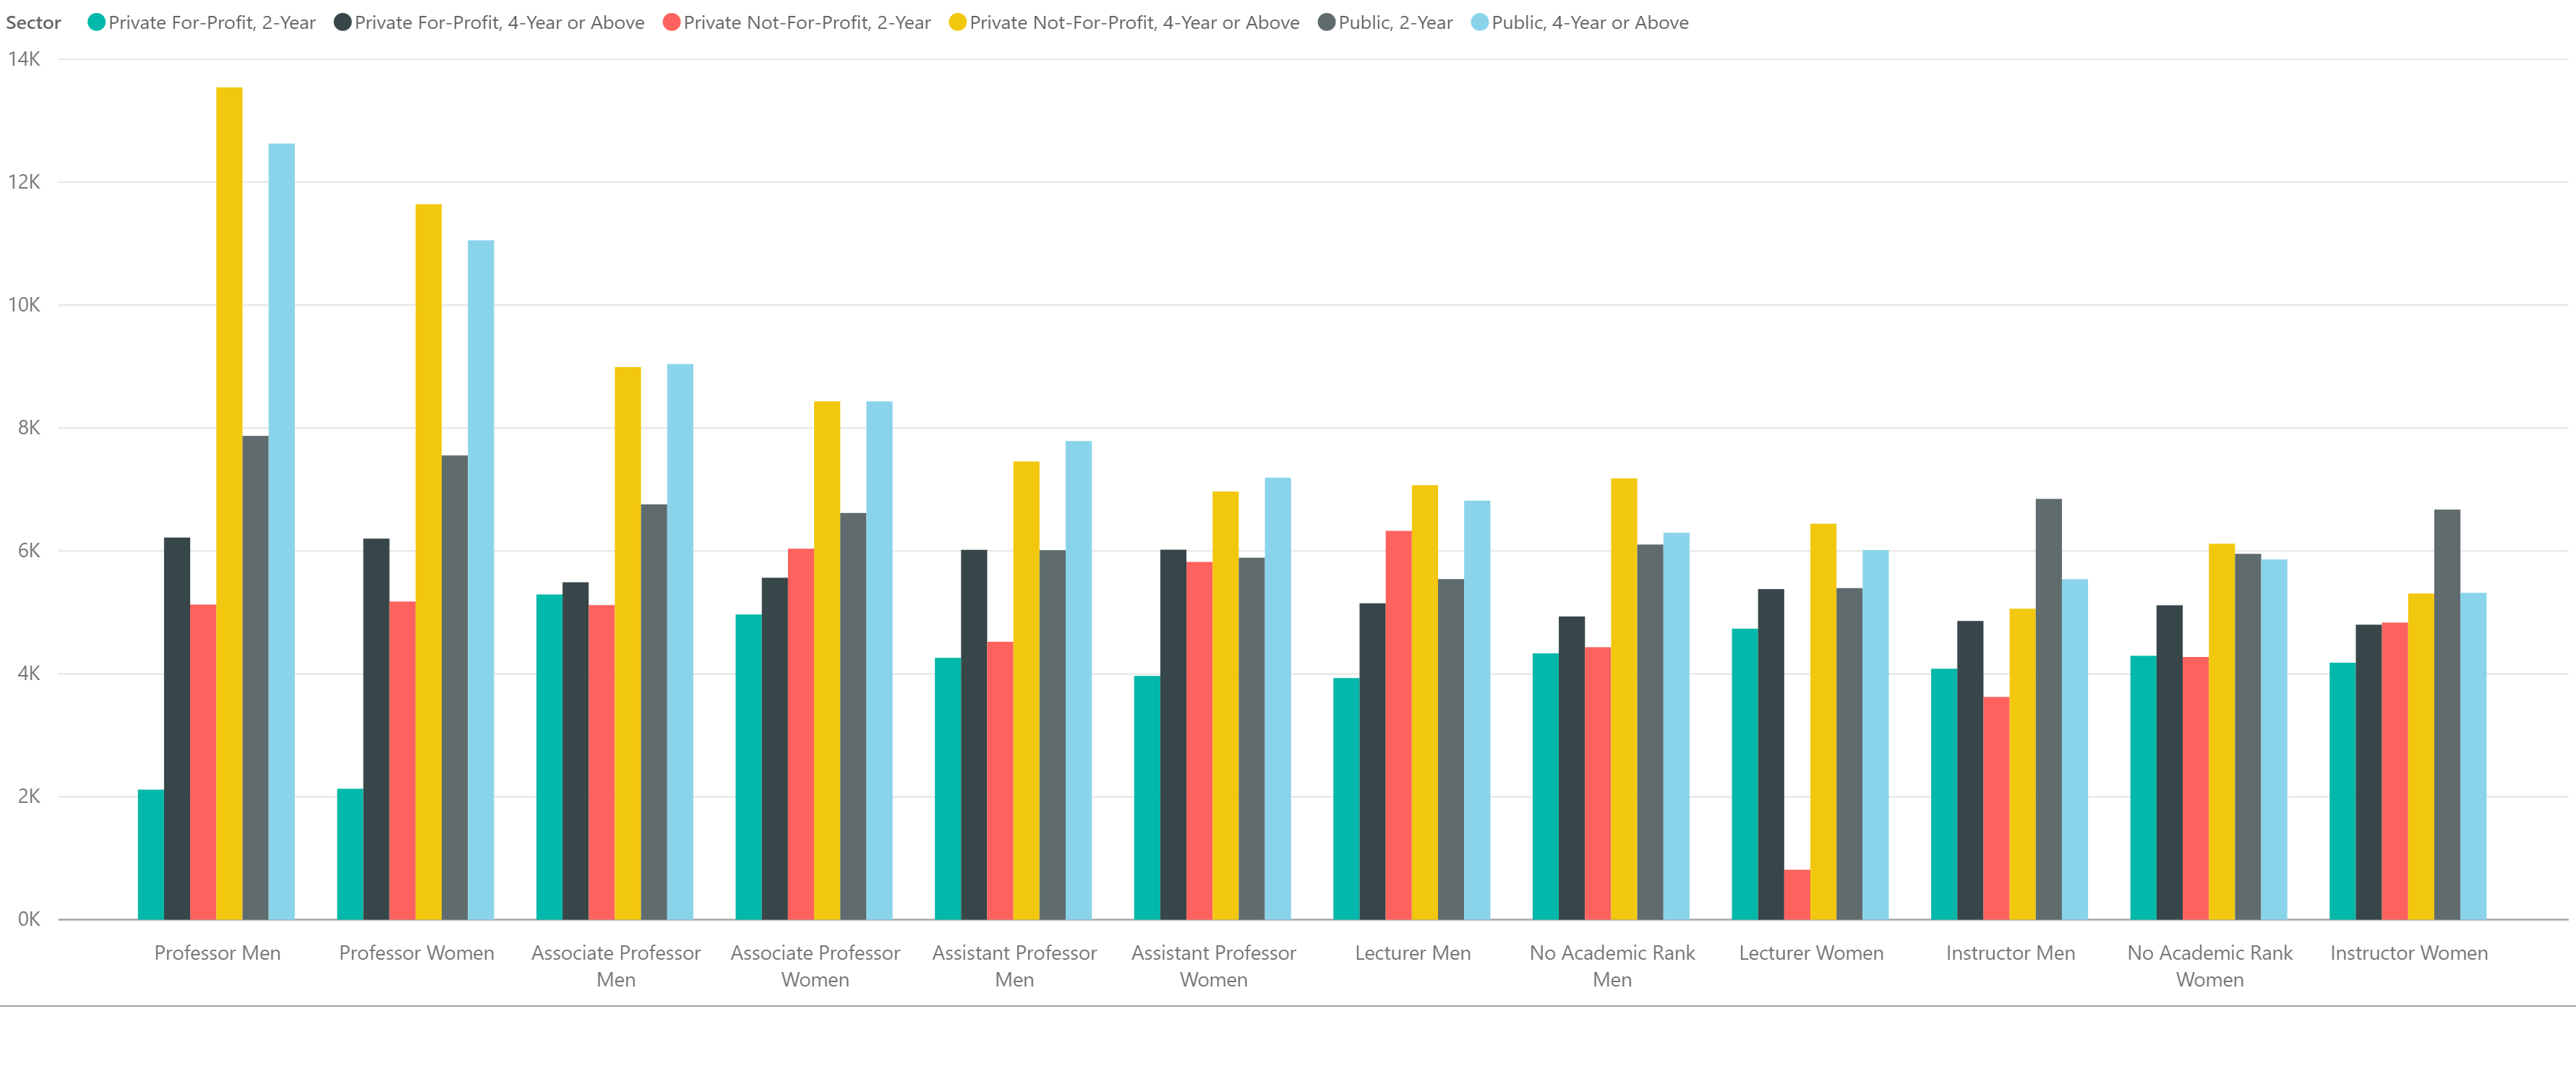
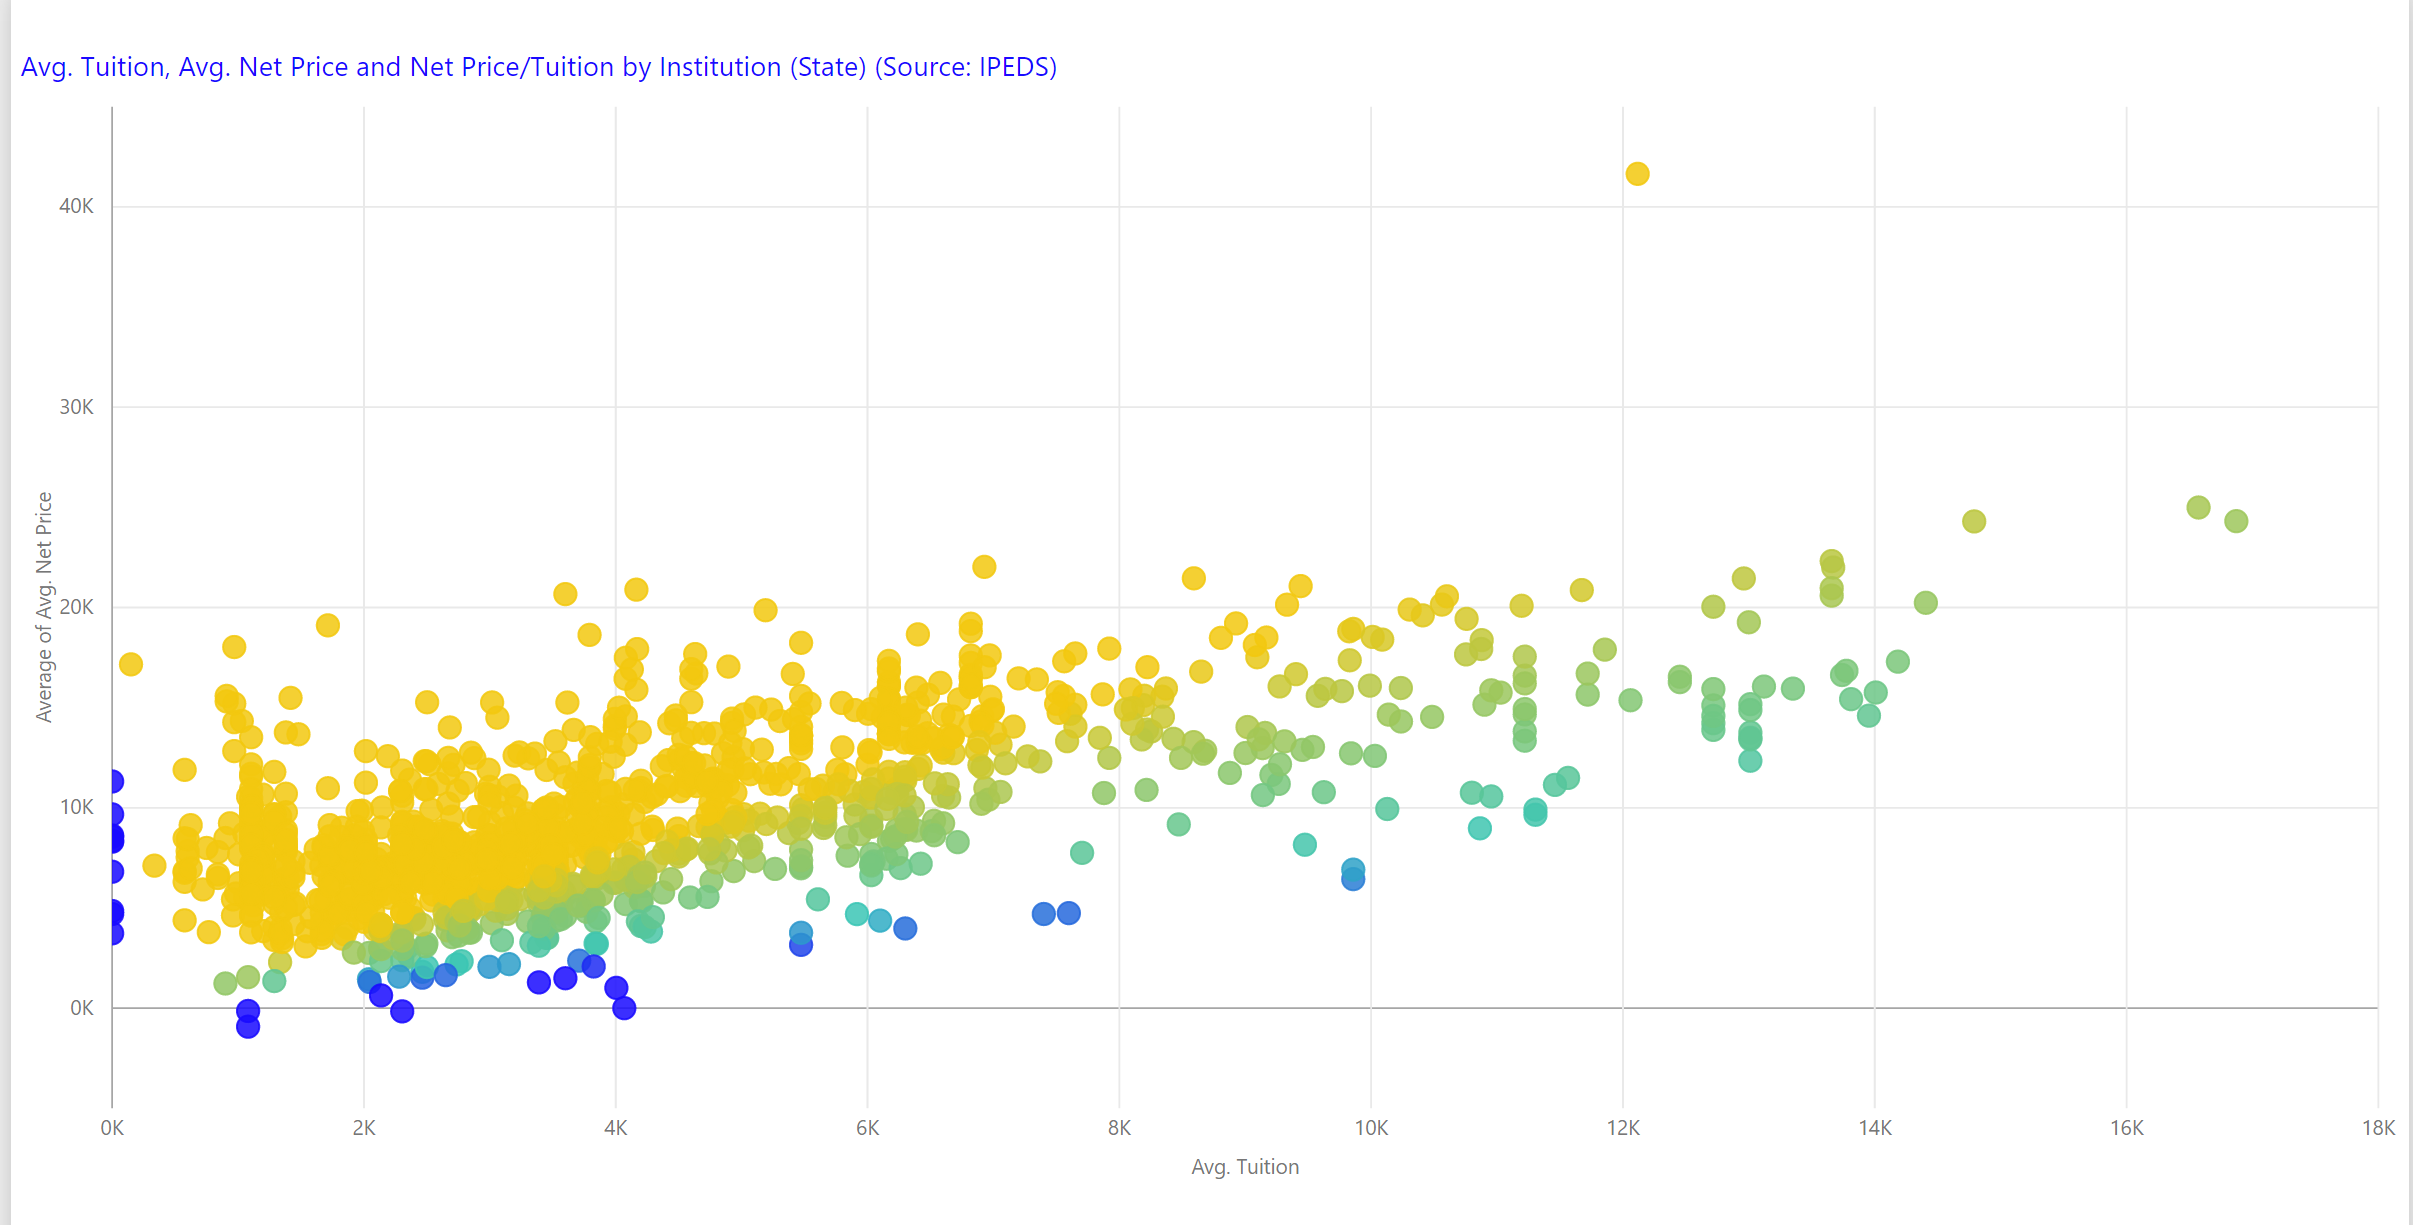
Likewise college pricing has become a pretty transparent process. Colleges have to disclose their published tuition, average tuition, and something called the net price. Tuition is inflated by other fees such as room and board, supplies, and other expenses. Colleges also provide “free money” such as scholarships, grant aid, and education tax benefits. This reduces the overall cost of college.  The net price therefore is the total costs of attendance minus the free money. Colleges have to provide a net price calculator to help prospective students calculate their prospective costs of education. Colleges also report as part of the Title IV financial aid submission to the Integrated Postsecondary Education Data System (IPEDS) their average net price from year to year. However, net price remains a largely unknown term when it comes to comparing colleges. Google searches for net price as a search term are about 2% of the searches under tuition.


So Harvard’s reported average tuition is $40,418 but its net price is $15,095. Over half of the cost of attending Harvard including housing costs and other fees is subsidized by grants, scholarships, and tax benefits.  Penn State on the other hand has an average tuition of $16,572 but its net price is much higher at $24,220. If you attended Penn State from out of state, you could expect to pay much more than this as these are in-state numbers. Net price varies widely by individual situation, but the composite net prices while largely unknown do serve as a general barometer for the affordability of a college.


You can compare published tuition, average tuition, and net price for every college in the U.S. by downloading a spreadsheet HERE.

Share This Story

Similar Posts

  • Healthcare Rankings and the Healthiest Cities

    We in the U.S. love our rankings. I think it is embedded in our DNA. As a student of data, I love to see the various rankings and how people get worked up over them. Healthgrades recently released its latest analysis of top quality hospitals and its National Health Index, which…

  • The Aging of Housing in America

    They are building three new homes across from my house here in Northeast Ohio. It seems we are past the time of the severe slowdown of housing starts and there has been a mini-housing resurgence. Home inventory levels remain low. The problem is, like my new neighbors, new housing tends…

  • Outpatient Medicare Hospital Costs up 13%

    The 2016 outpatient procedure data shows overall hospital volume up 11% from 2015. Using data from the Outpatient Procedure Analysis Interactive, we also found that the volume times the average full cost (weighted average cost) on a procedure basis has increased 13.3%. We ran the numbers several ways – first…

  • 12 Colleges with Sustained Enrollment Growth

      According to data collected from the Integrated Postsecondary Education Data System (IPEDS), 60.6% of colleges experienced flat or declining enrollment growth while only 39.4% experienced increasing enrollment growth from 2013-2014. This is also very consistent with statistics from 2012-2013.   College enrollment growth may be hard to sustain and…

  • Death Rates Rise Sharply for Millenials

    The new CDC mortality data continues to paint a rather grim picture. Last week we focused on the external causes of the rise in death rates. This week we analyzed the mortality (death) rate among age groups using over 1.8 billion data points over 17 years from the CDC. You…

  • Regional Disparities in Health Insurance

    We all know that health insurance is a moving target. According to the most recent ACS survey data, the national uninsurance rate declined from 13.0% to 11.7% in 2016. Public insurance coverages increased slightly more than private coverages (increases of .9% and .6%) respectively. This change was short-lived as Gallup…