Loan repayment rate data may trigger resurgence in default rates
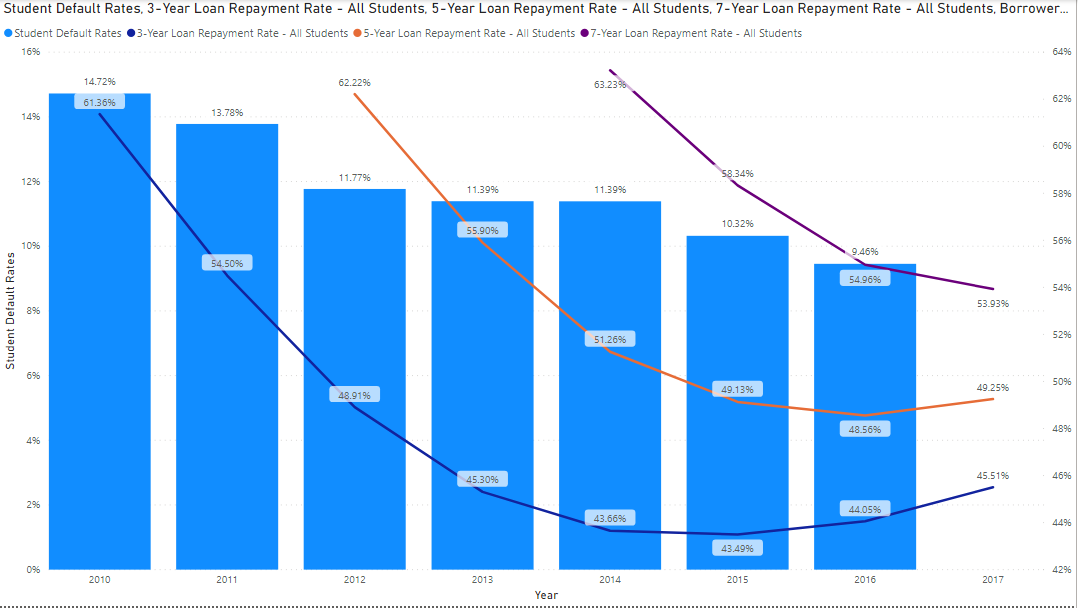
The most recent Federal Student Aid student default rate data indicates that the composite student default rates declined from 10.8% in 2015 to 10.1% in 2016, a decline of 6.5% and continuing a seven-year post-recession trend. In 2010, the default rate was nearly 15%. Cause for celebration, right? Not necessarily.
The National Student Loan Data System (NSLDS) also published student debt data as part of the College Scorecard data, but with a completely different slant. The NSLDS publishes one, three, five, and seven-year repayment rates. Repayment rates are measured as the rate in which the borrower pays into the principal of the loan, even if it is one dollar. This is a measure of progress in paying down one’s loan. This metric also obviously could be a windshield into what the default rates might look like downstream. The idea is something like this – if I stop paying for my house, I eventually would be in default. The timing is unclear when payment risk becomes default risk.
Unfortunately, the repayment rates had also been steadily declining massively in the same period as noted in the graph below against student default rate data (we calculate slightly different default numbers but same trajectory). The three-year and five-year repayment rates finally nosed back up in the latest 2017 published data.
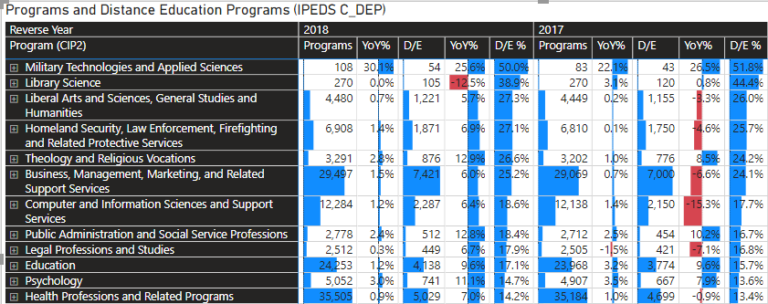
You can create your own similar analysis at the institution level using the Insight for Higher Education Interactive.

Power Insights Will be Off for the Holidays
We will be taking a break for the holidays. Our next post will be in mid-January. We look forward to a fabulous 2020 filled with new ways to harness public data for institutional benchmarking and market analysis. Have a wonderful Christmas and blessed holiday season!
About Public Insight
Public Insight transforms the islands of public data into actionable insights with analytic datasets and Microsoft® Power BI to better understand your industry and market. Insight for Higher Education is an easy-to-use executive planning and analysis application for benchmarking higher education institutions across a wide range of topical areas such as enrollment, graduation rates, degrees awarded, and staffing. Sign up for a free Factbook Interactive to explore how easy it is to navigate through public data.