New Violence Against Women Data on Campuses

A slug of new data has recently been released covering campus statistics on violence against women. This data was mandated by the Violence Against Women Reauthorization Act of 2013 (VAWA) and is added to numerous other statistics required under the Campus Crime Statistics Act, or Clery Act. College institutions must now compile statistics for incidents of domestic violence, dating violence, sexual assault, and stalking and to include certain policies, procedures, and programs pertaining to these incidents in their annual security reports.


Domestic violence is the willful intimidation, physical assault, battery, sexual assault, and/or other abusive behavior as part of a systematic pattern of power and control perpetrated by one intimate partner against another. It includes physical violence, sexual violence, psychological violence, and emotional abuse. Dating violence is violence committed by a person who is or has been in a social relationship of a romantic or intimate nature with the victim is dating violence. Stalking is a course of conduct directed at a specific person that would cause a reasonable person to feel fear.


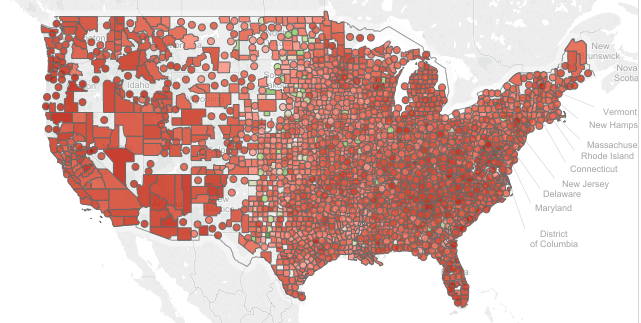
A total of 2,029 colleges reported 12,171 total offenses under these specific definitions including 3,992 acts of domestic violence, 3,570 acts of dating violence, and 4,609 acts of stalking. The data must be further reported by the location of the offense. When marrying the total offenses under the VAWA to the female enrollment, we find that an average of 140.6 offenses occurred per 100,000 female students.  You can view any of the campus safety data by institution for free in Public Insight. 


You can download a spreadsheet of all U.S. institutions and the reported number of offenses by category by clicking on this link. I have also shown the female enrollment and the calculated offenses per 100,000 female students. Finally, I have reported some summary data based on Institutional Affiliation and Size and Setting Classification.

Share This Story

Similar Posts

  • College Building Boom Approaches $1 Trillion

    Postsecondary institutions continue to invest heavily in capital assets and the cumulative investment across public and private institutions has crossed $900 billion, an increase of 27% over a five-year period. The capital investment growth rates are almost identical for both public institutions and private non-profit institutions as noted in the…

  • When is Free Tuition Really Free?

    The sticker pricing game has been in place a long time. No one ever pays full sticker price for items such as jewelry or cars. That is probably why University of Michigan came under scrutiny for its free tuition guarantee for families with income under $65,000. Cynics pointed this out…

  • Decoding Outcome Measures Data

    Breaking Down the Second Year Student Success Measure The IPEDS Outcome Measures data was designed as a supplement to graduation rate data which has always been questioned as an effective measure for measuring student outcomes. Outcome Measures is now in year two of its collection and provides a lot of…

  • Cleveland, TN a Hot Market for Job Growth?

    I live in Cleveland, Ohio (home of Lebron James and the Rock ā€˜N’ Roll Hall of Fame). I would love to believe that our city is having explosive job growth but the real winner according to the latest Occupational Employment Statistics (OES) survey is not Cleveland, Ohio, but Cleveland, Tennessee….

  • Tuition Bears Increasing Brunt of Higher Ed. Revenue

    In 2011, Tuition and Fees represented 20.6% of public institutional revenue. In 2015, it has increased to 24.25%. Most of the reshuffling of revenue has come from federal operating grants and contracts as noted by the graphs below. Interestingly, state appropriations have remained relatively constant. Similarly, non-profit institutions have seen tuition…