Real Estate, Personal Care, and Uber Top Latest Self-Employment Data

The U.S. Census recently released its 2015 Nonemployer Statistics. This data is the companion data set to the County Business Patterns. Nonemployer Statistics is an annual data set that provides county economic data for businesses that have no paid employees and are subject to federal income tax. The data consist of the number of businesses and total receipts by industry. Most nonemployers are self-employed individuals operating unincorporated businesses (known as sole proprietorships), which may or may not be the owner’s principal source of income.


Self-employment continues to inch up. The number of nonemployer establishments increased 3.28% to 24.3 million in 2015. By comparison, the number of employer based businesses only increased 1.22% to 7.6 million. Thus, for every employer establishment in 2015 there are 3.2 small self-employed businesses. As a whole self-employment is still only $1.16 billion of receipts compared to annual payroll of $4.9 billion or 23%. As the nation has regained its footing, self-employment still continues to flourish. 

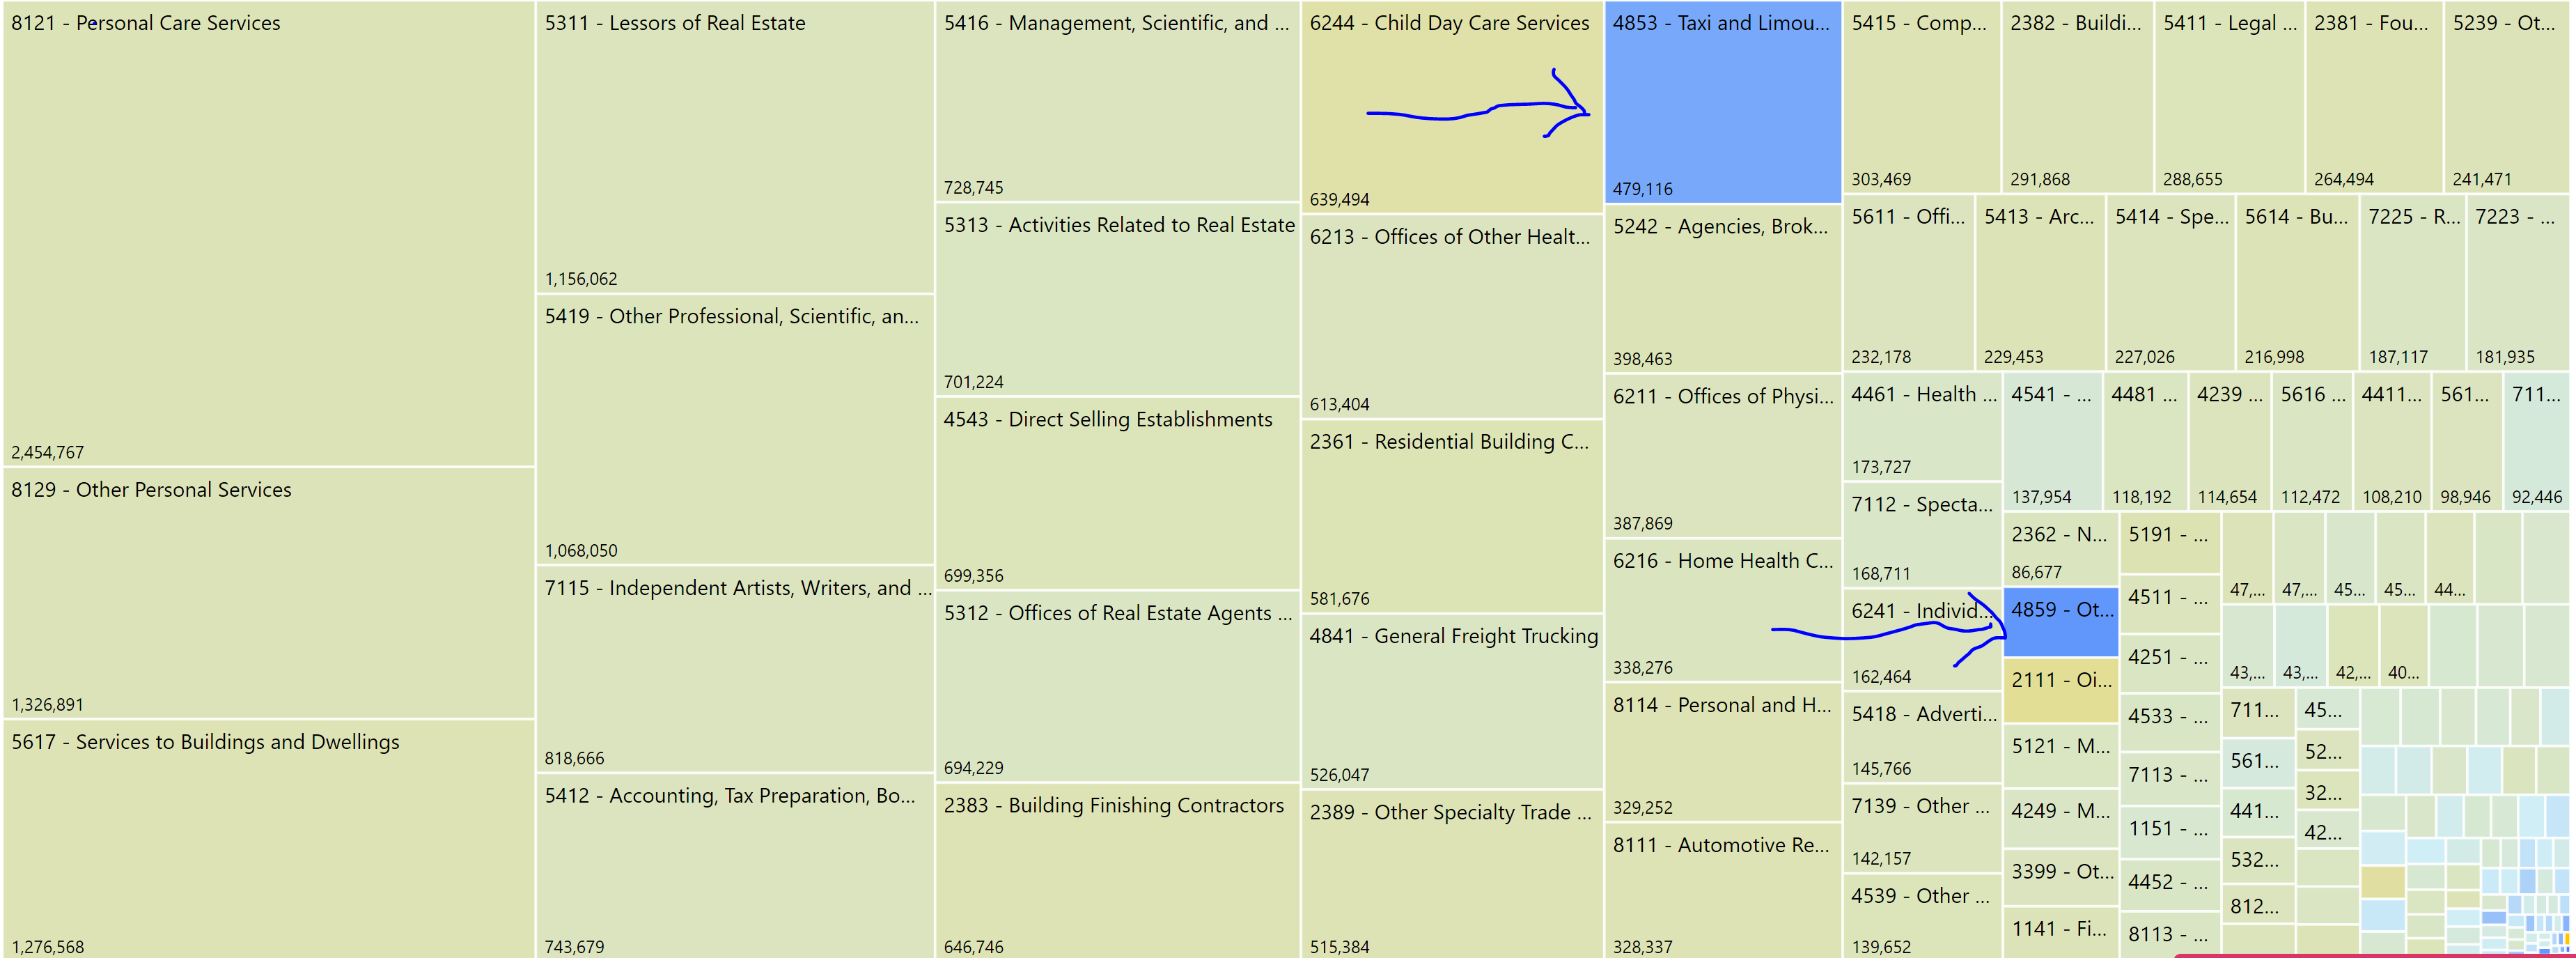
  • The top number of establishments for self-employment continues to be personal care services.

  • Of the top 10 number of self-employed industries, real estate comprises three of them. The number 11 ranked industry is also in real estate.

  • Real estate smokes the amount of self-employment gross receipts where it is nearly three times the next highest amount from personal care services. These types of businesses, for the most part, are your landlords.

  • Other notable top 10 self-employment professions include accountants, management consultants, and independent artists.

  • The highest growth area should not be a surprise – transportation (e.g. Uber and Lyft) are exploding with growth rates of betwen 60 and 70%. The tree map below shows the islands of growth (blue color) in the transportation industry.


Share This Story

Similar Posts

  • On Faculty Compensation and Gender Disparity

    It will take many years for the faculty gender pay gap to close at the current rate of change. From 2014 to 2015, women received around half a percent higher pay increase from men over the various institutional sectors. There is still a 16% and 14% gender pay gap for full professors…

  • Friendly Skies Just Got Friendlier

    Airlines have taken it on the chin in recent months for bad customer service. This despite the fact that overall customer service rankings of the airline industry are up. Flight attendants received nearly a 14% bump in pay based on a comparison of mean wage data from the 2016 Occupational…

  • Spring is Here! Which Counties are Physically Active

    I love spring!  As a warm weather person living in the Northeast, I can’t wait to get outside and be physically active. While many are like me, still 29% of the U.S. remains by and large physically inactive and it is very regionally concentrated. The County Health Rankings uses a measure…

  • Fringe Sport Participation

      In this Data Dan video, Dan uses data from the Equity in Athletics data set from Title 9 Participating schools to look at fringe sports at colleges across the country.  

  • Top Ten States with Growing Tuition Costs

    Nell Gluckman of The Chronicle of Higher Education wrote an interesting piece about the challenges of public cutbacks in the state of Louisiana. The premise of the article is that there are trickle-down implications of state cutbacks in tuition, faculty morale, and curriculum. Louisiana has passed along substantial tuition increases to its…

  • The Gender Debt Disparity

    The Huffington Post recently posted a very interesting article on gender debt disparity. The article notes that women hold nearly two-thirds of all student debt – a whopping $833 billion dollars. The article postulates that women also take longer to pay off the debt because they earn less than men….